


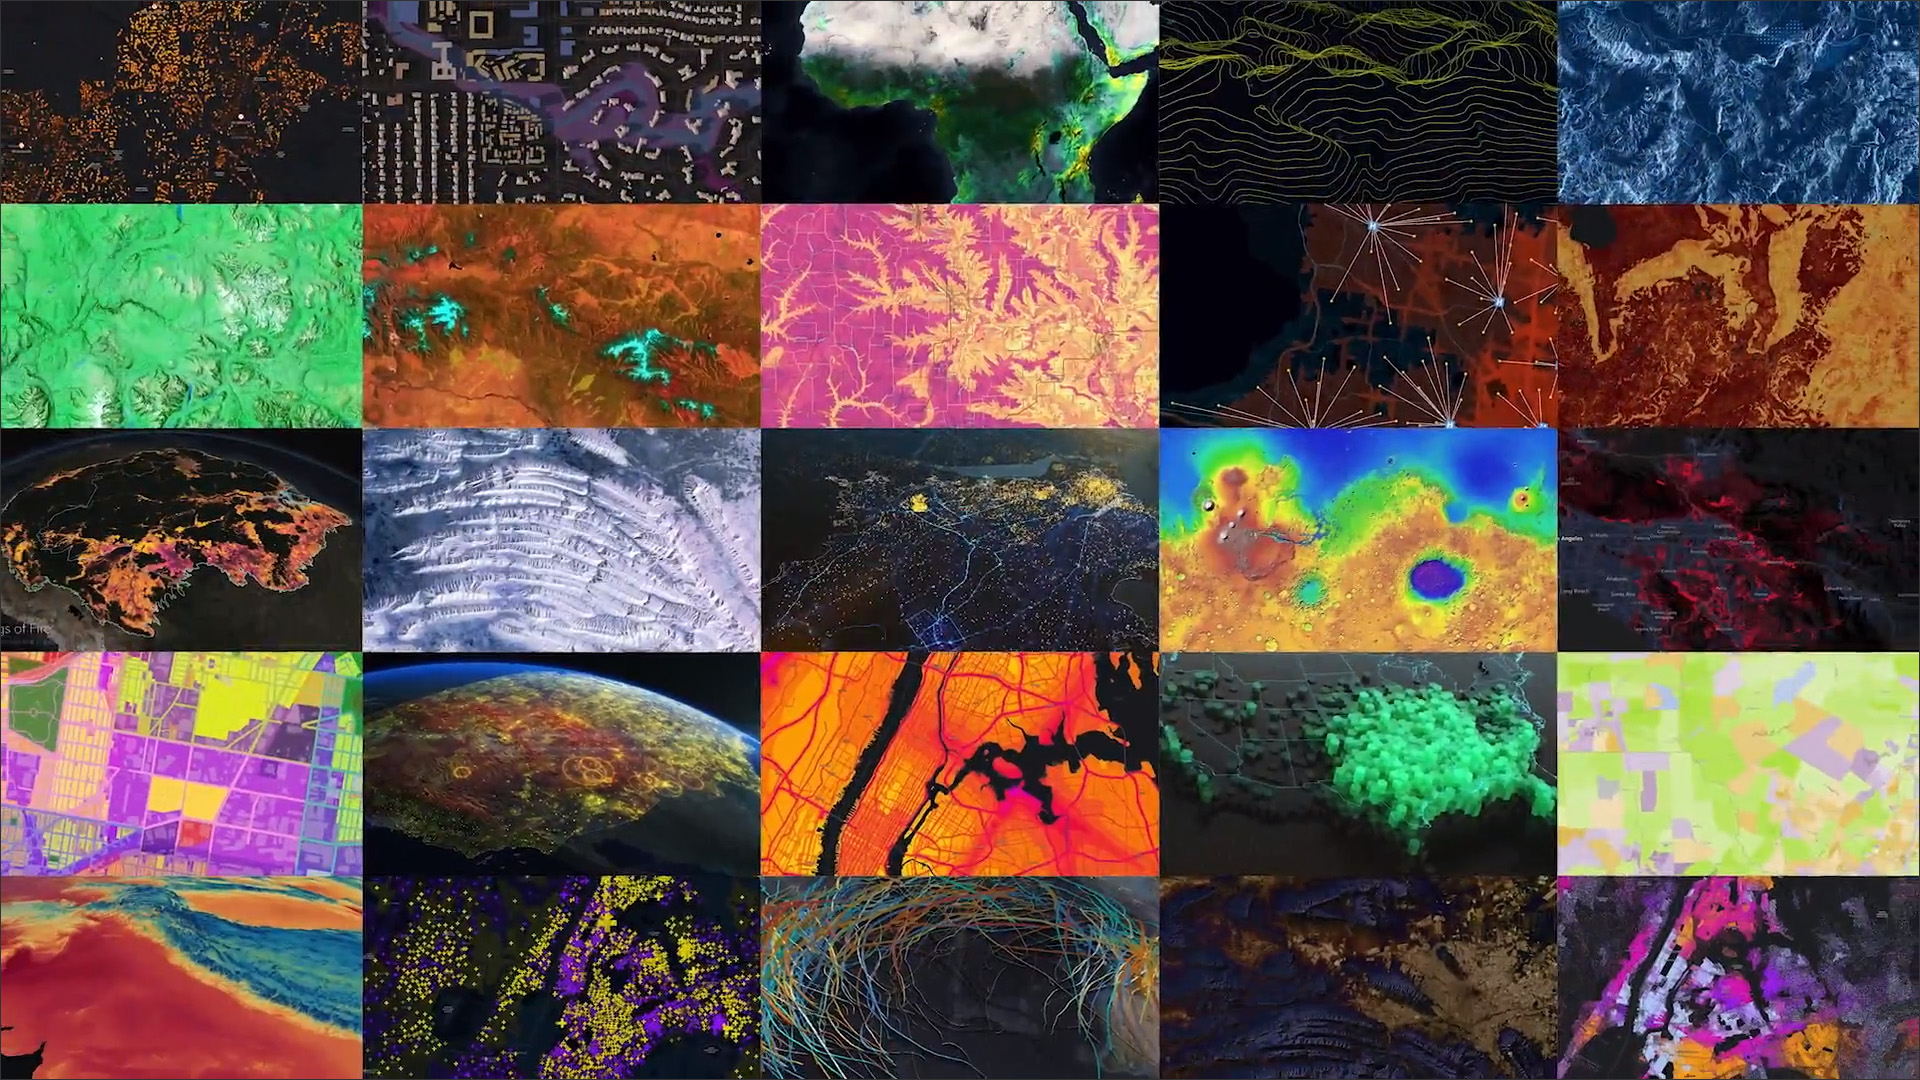
The leading GIS software company, Esri, held its annual user conference last month, and I was able to tune in to its plenary sessions online, which provided an insight into how its ArcGIS products were being used in multiple ways across the world in varied domains including agriculture, environment, communication and connectivity, urban planning and transportation, communication and connectivity, disaster planning and management, and more (Figure 1). The ability to map out the world and overlay it with data — which is fundamentally what a GIS application does — seems to be one that is being put to work in countless ways across all fields of human endeavor and is likely to continue doing so. This article provides an overview of some of the user implementations that were presented at the conference, including those from the AEC industry.
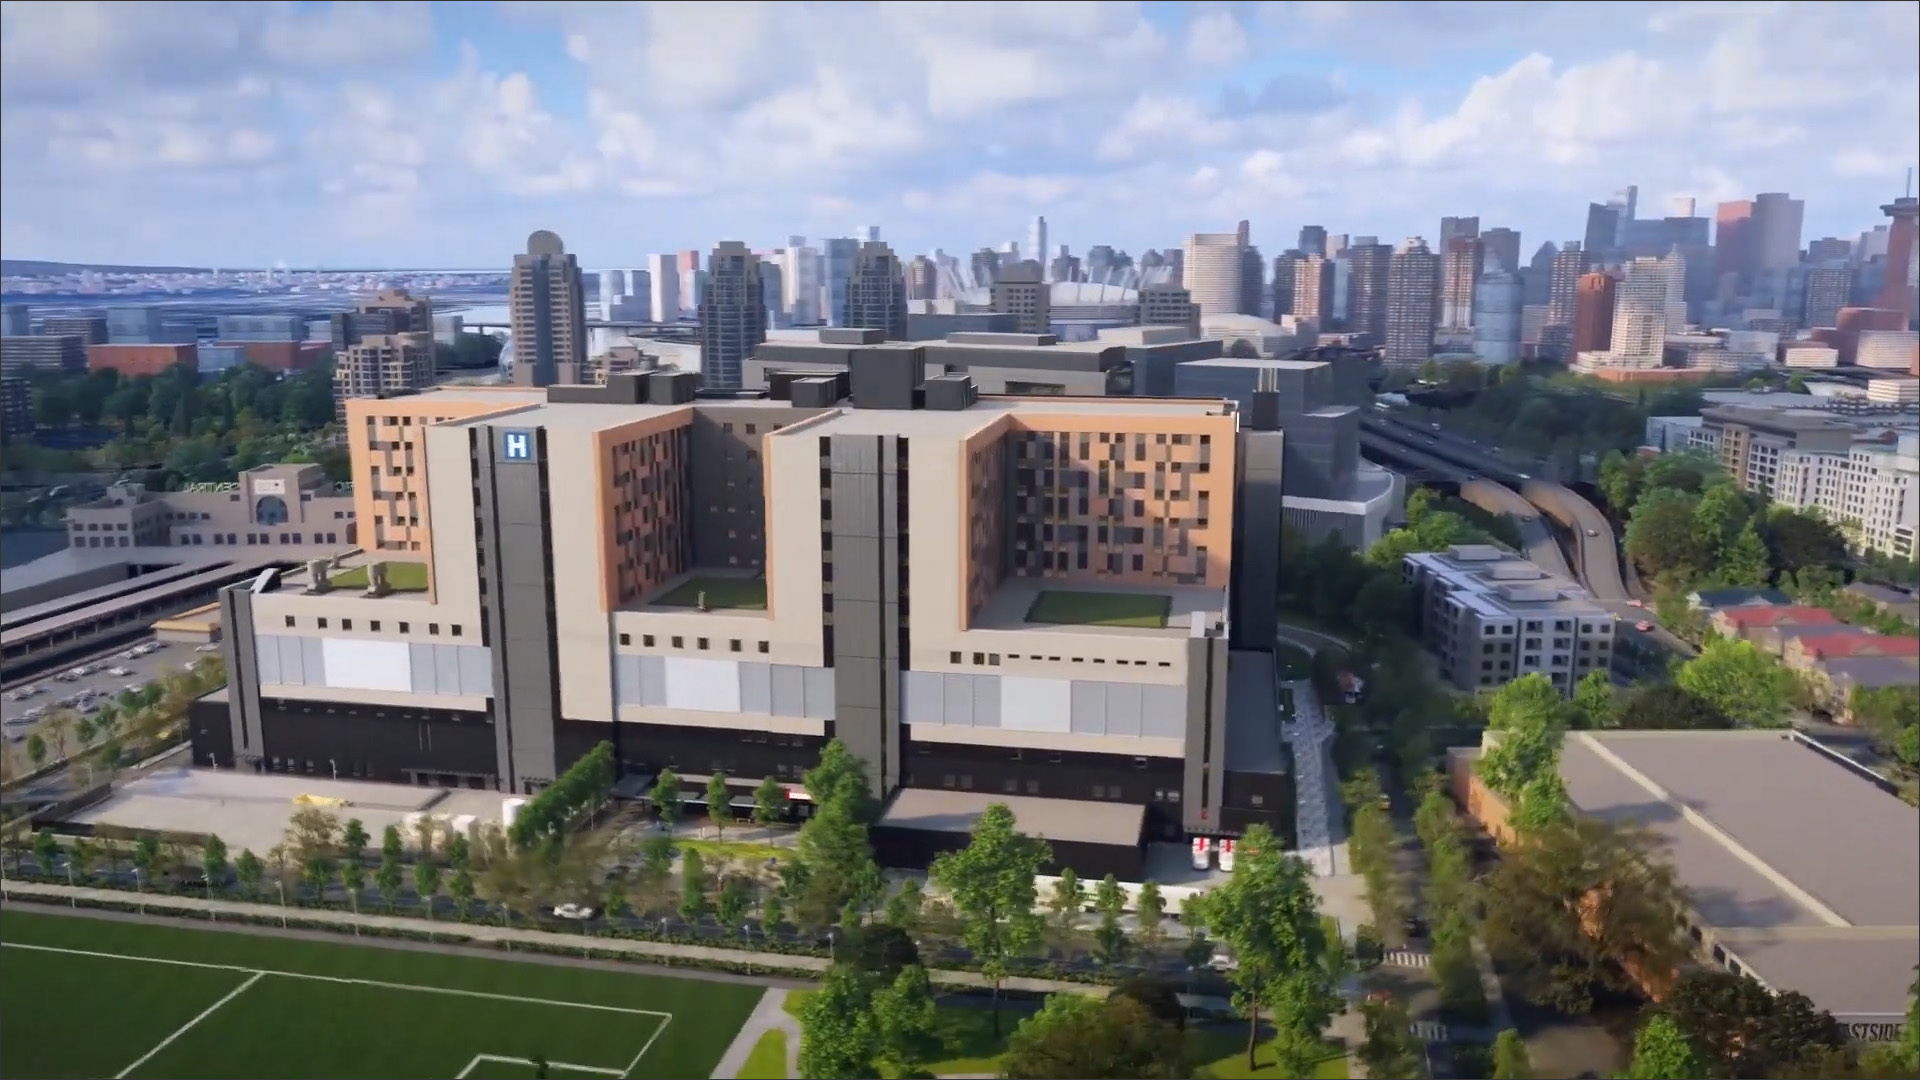
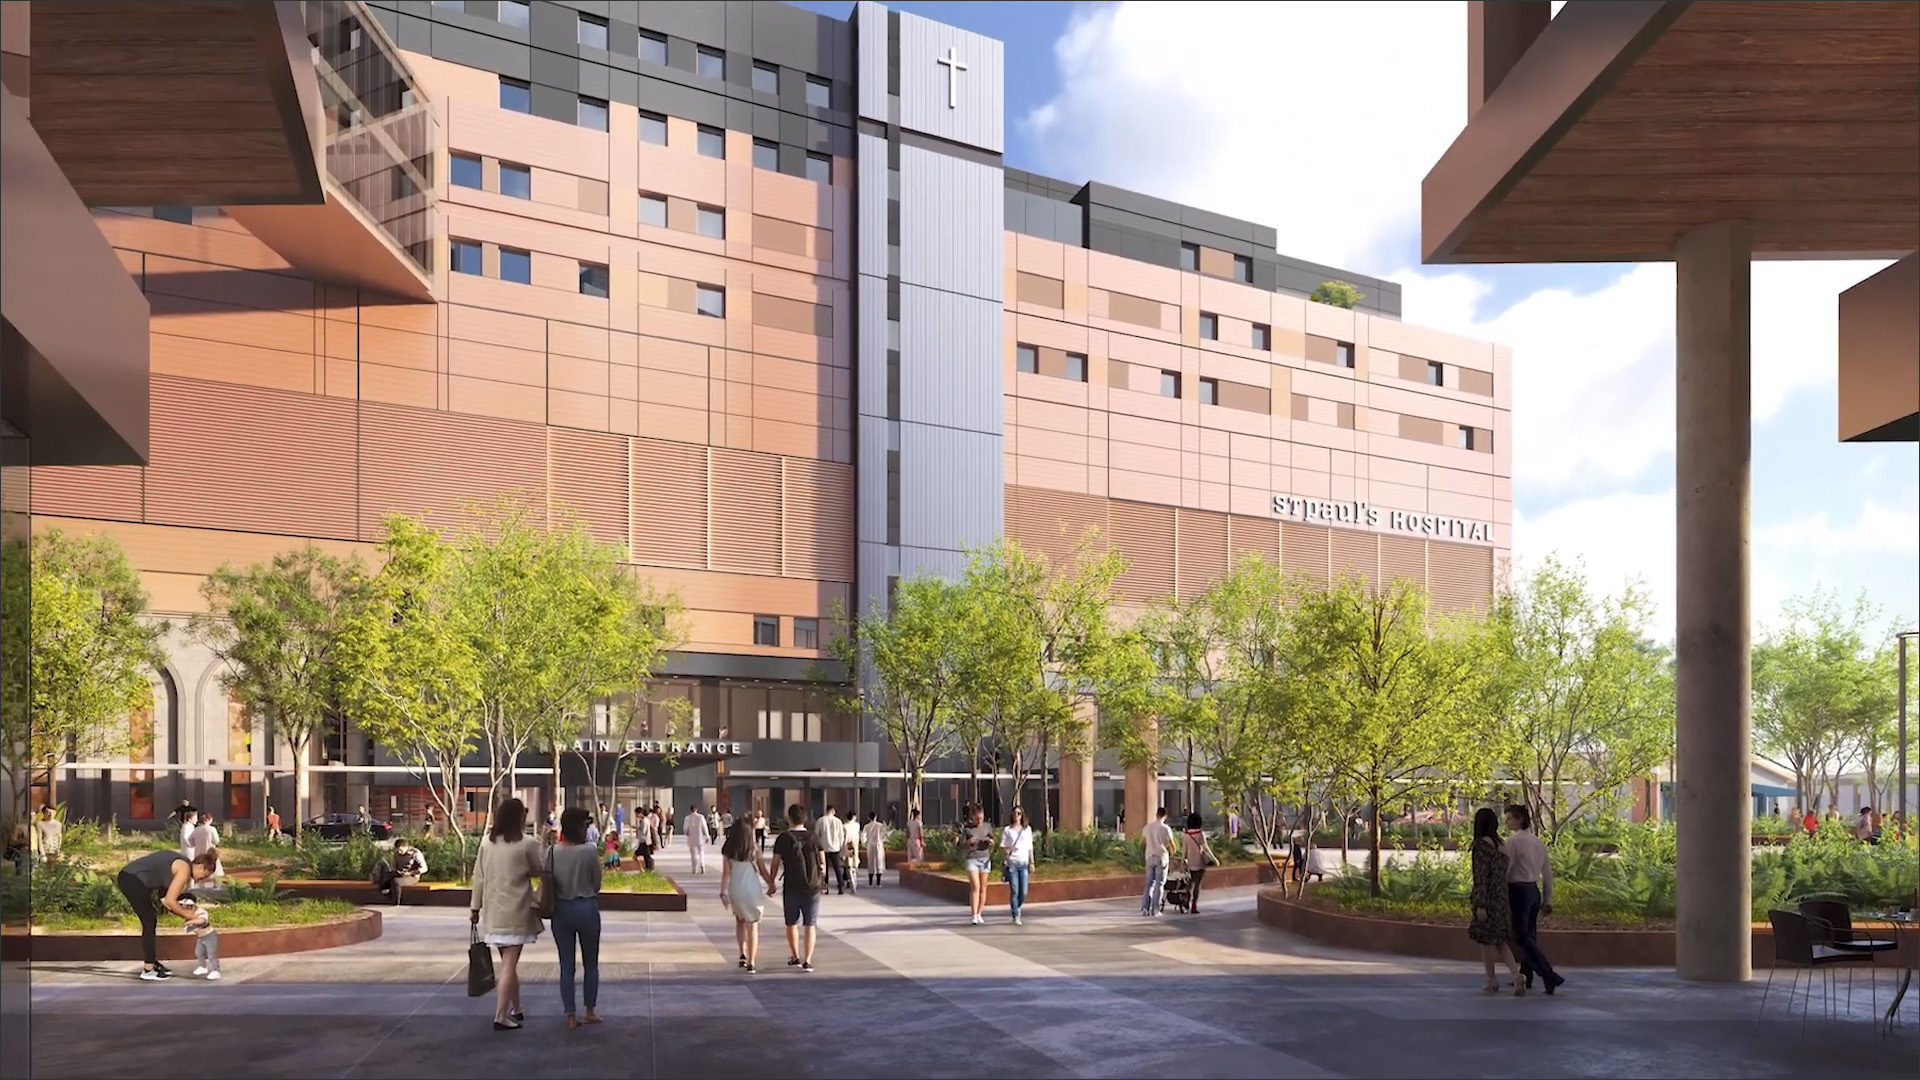
PCL Construction, a Canadian construction company, shared how it was using ArcGIS in the construction of one of its current projects, the $1.7 billion new St. Paul’s Hospital in Vancouver, Canada (Figure 2). The size of the project is over 2 million square feet, and it is scheduled to be completed in 2026. The firm is working hand in hand with a progressive owner, Providence Health, in a Design-Build project team environment, which is encouraging it to push the envelope when it comes to the deployment of technology to not only optimize the construction of the project but also prepare a digital handover of the project for intelligent BIM-enabled operation and maintenance.
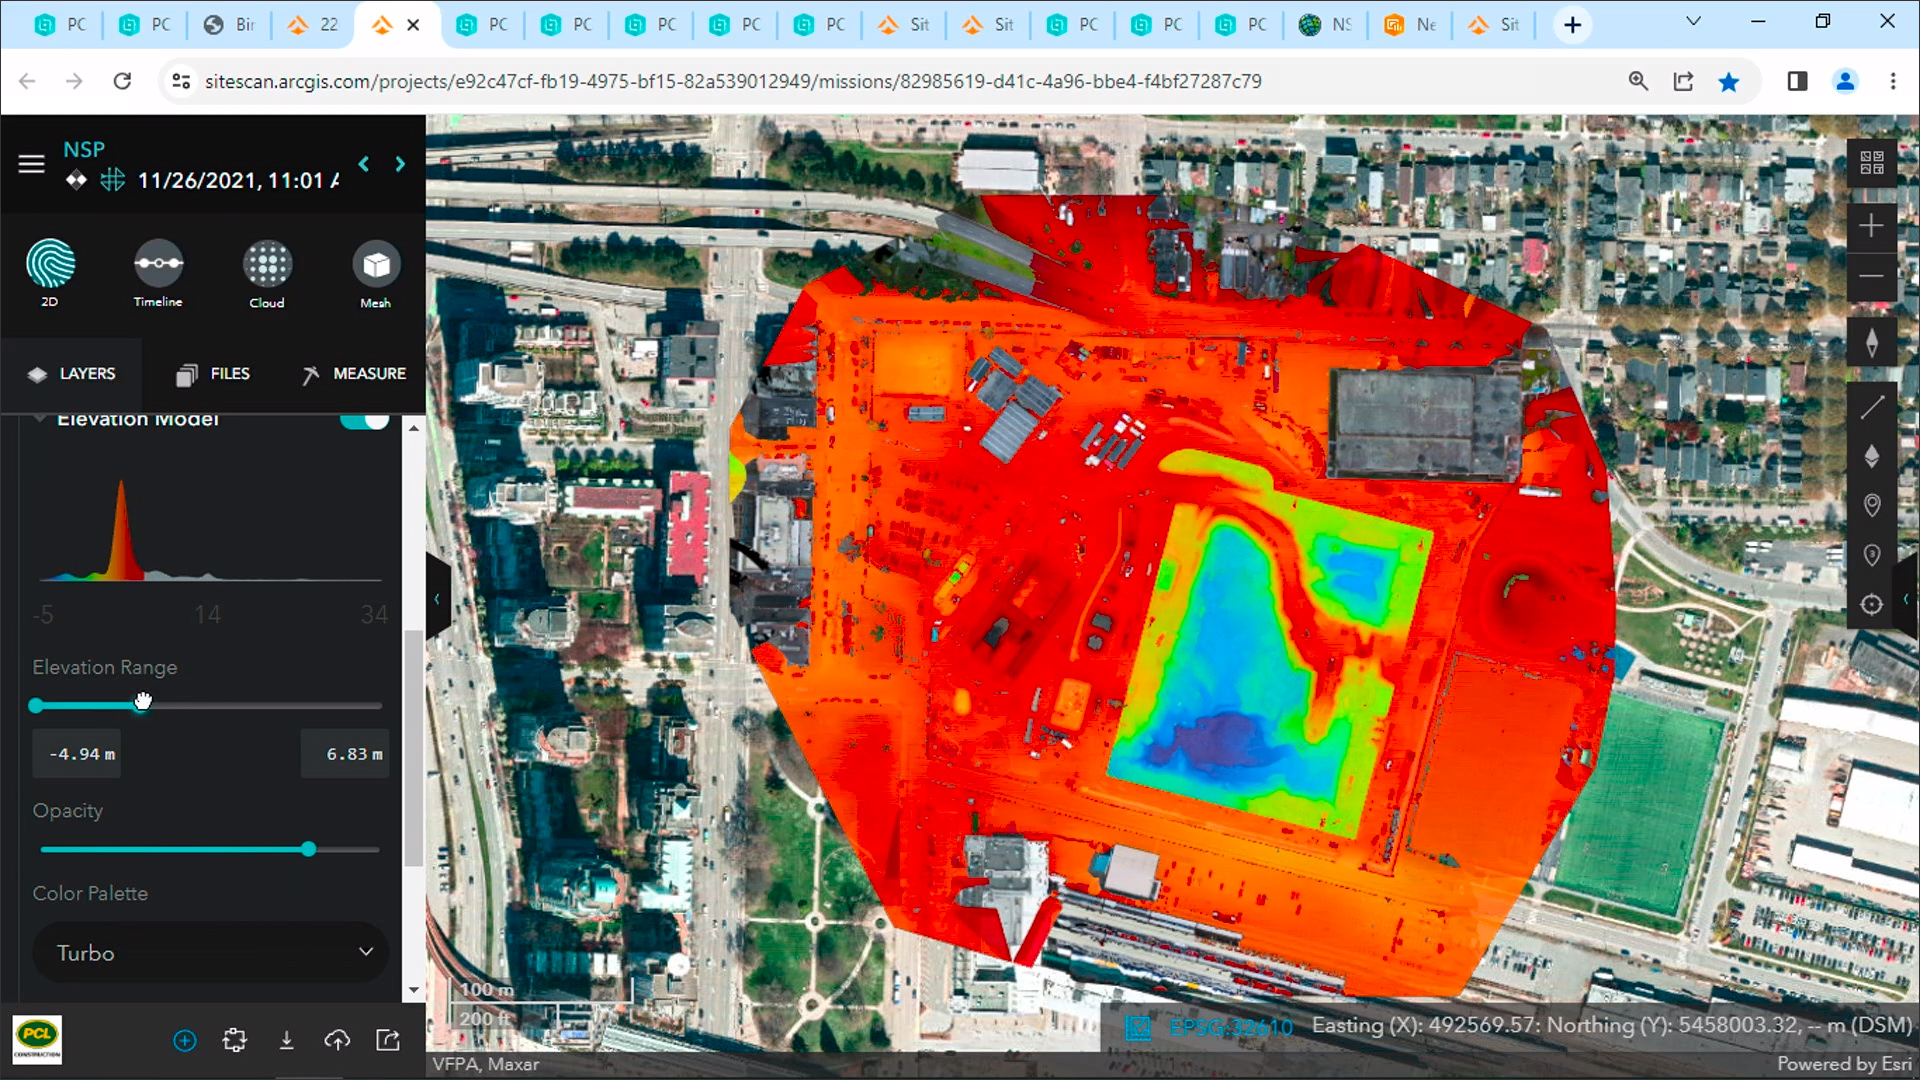
PCL Construction used SiteScan for ArcGIS to create a highly detailed map of the construction site, which was updated with data from drones that were deployed to fly every week to monitor the construction progress (Figure 3). Depth data was included, which also allowed elevation heats maps of the site to be created, showing the position of ramps and excavated areas (Figure 4). This map served as a living canvas that the construction team could use to plan out the site logistics, see what resources are available, add more as needed, determine the locations where construction equipment should be placed, and perform excavation analysis. It allowed everyone on the team, including the construction crew on site, to get real-time updates on the current status of the construction, which allowed it to proceed much more smoothly.
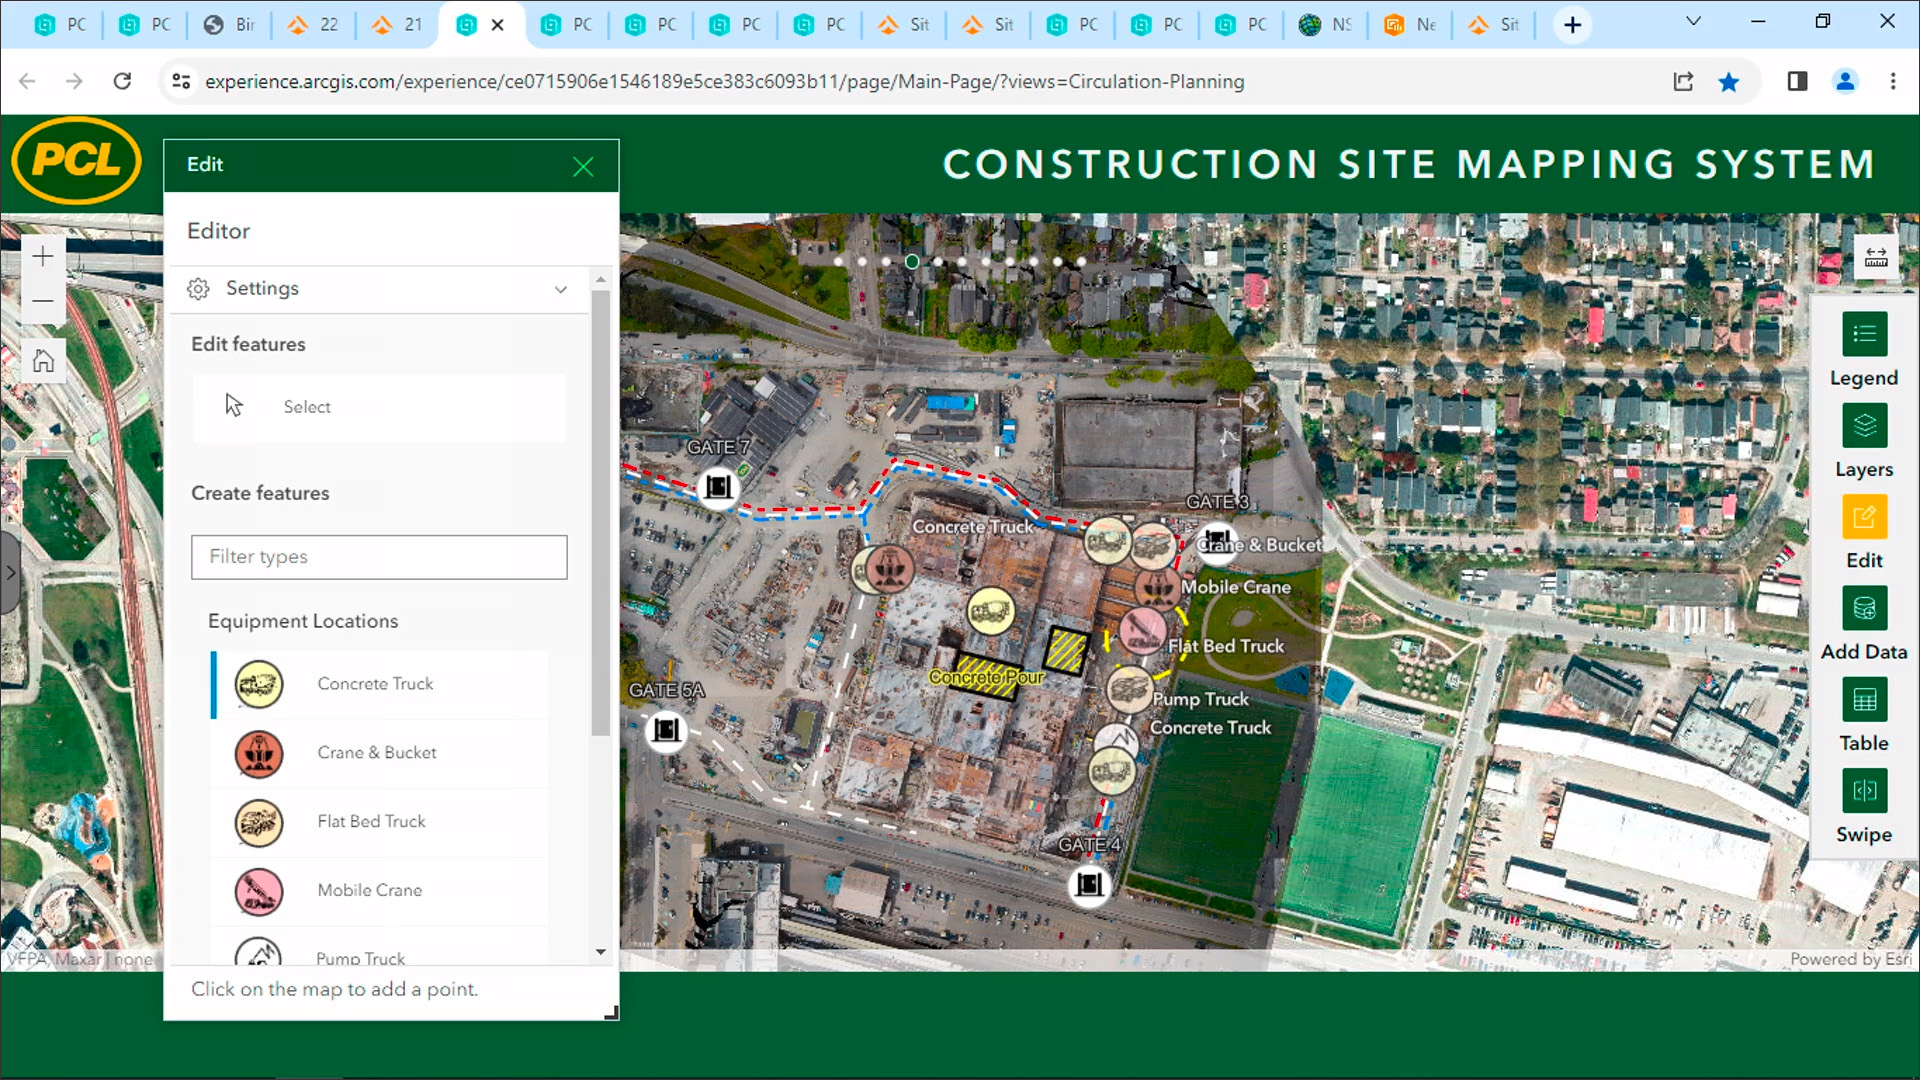
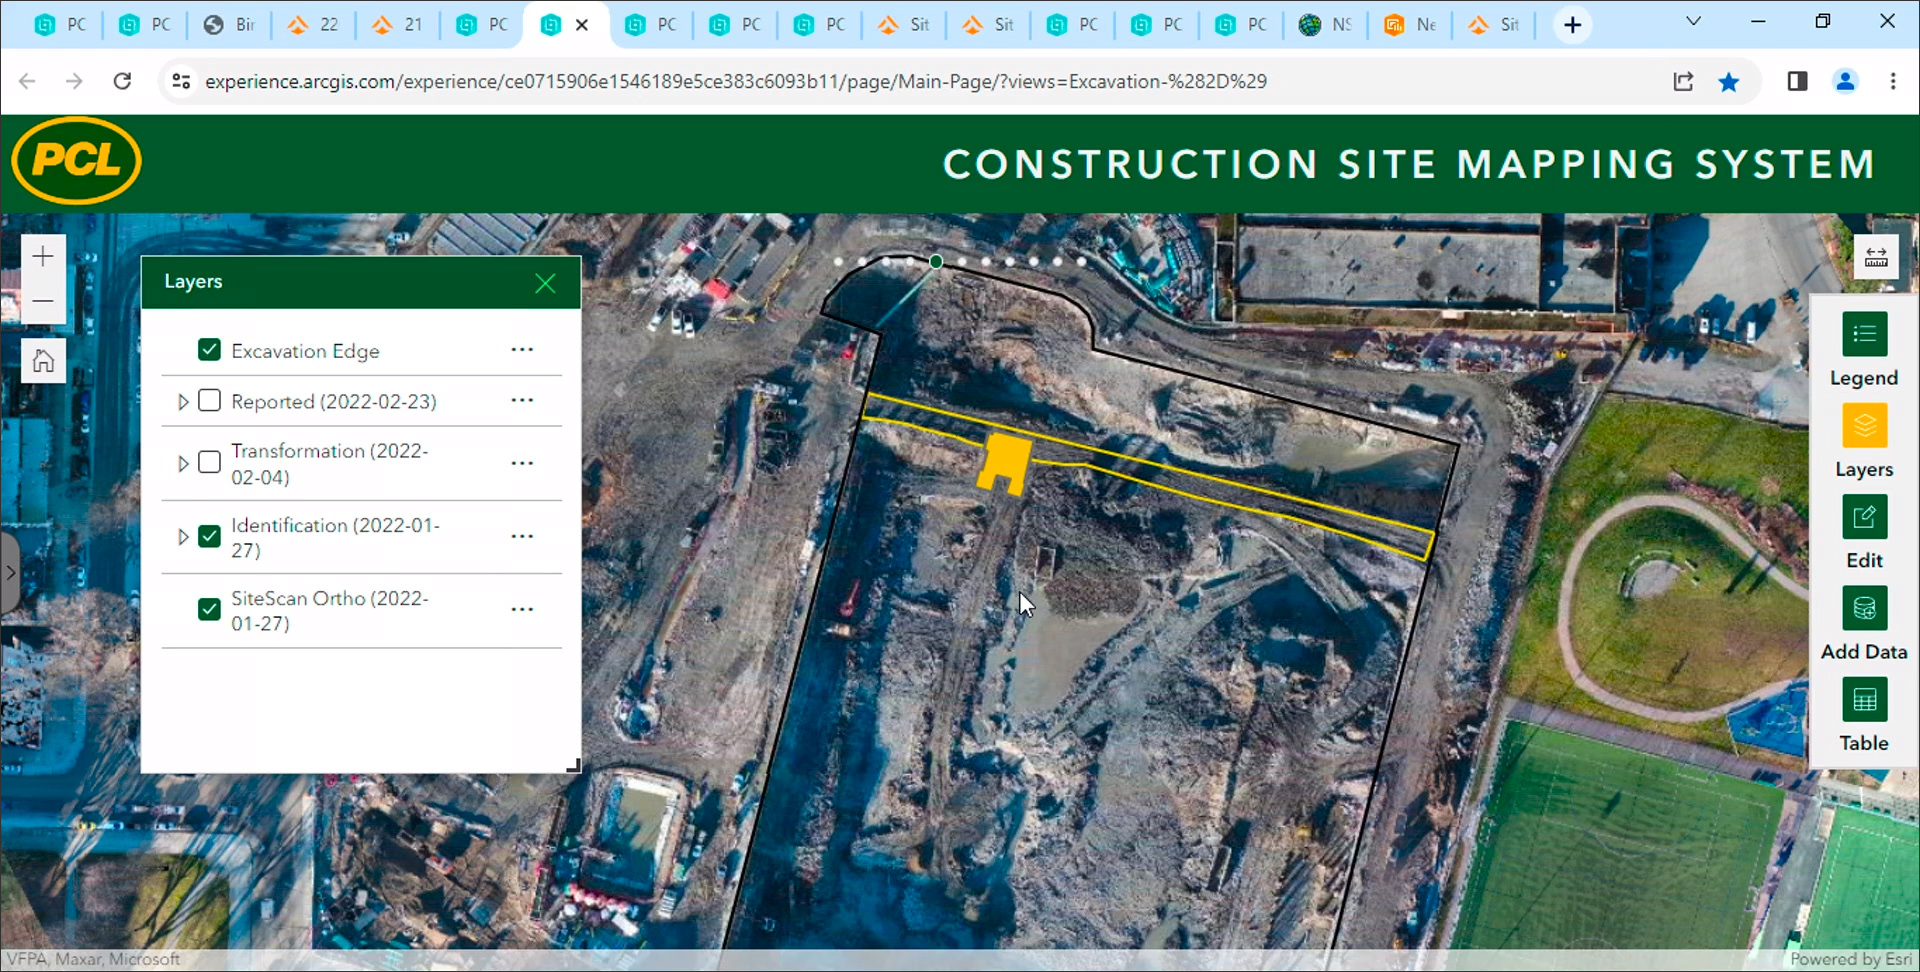
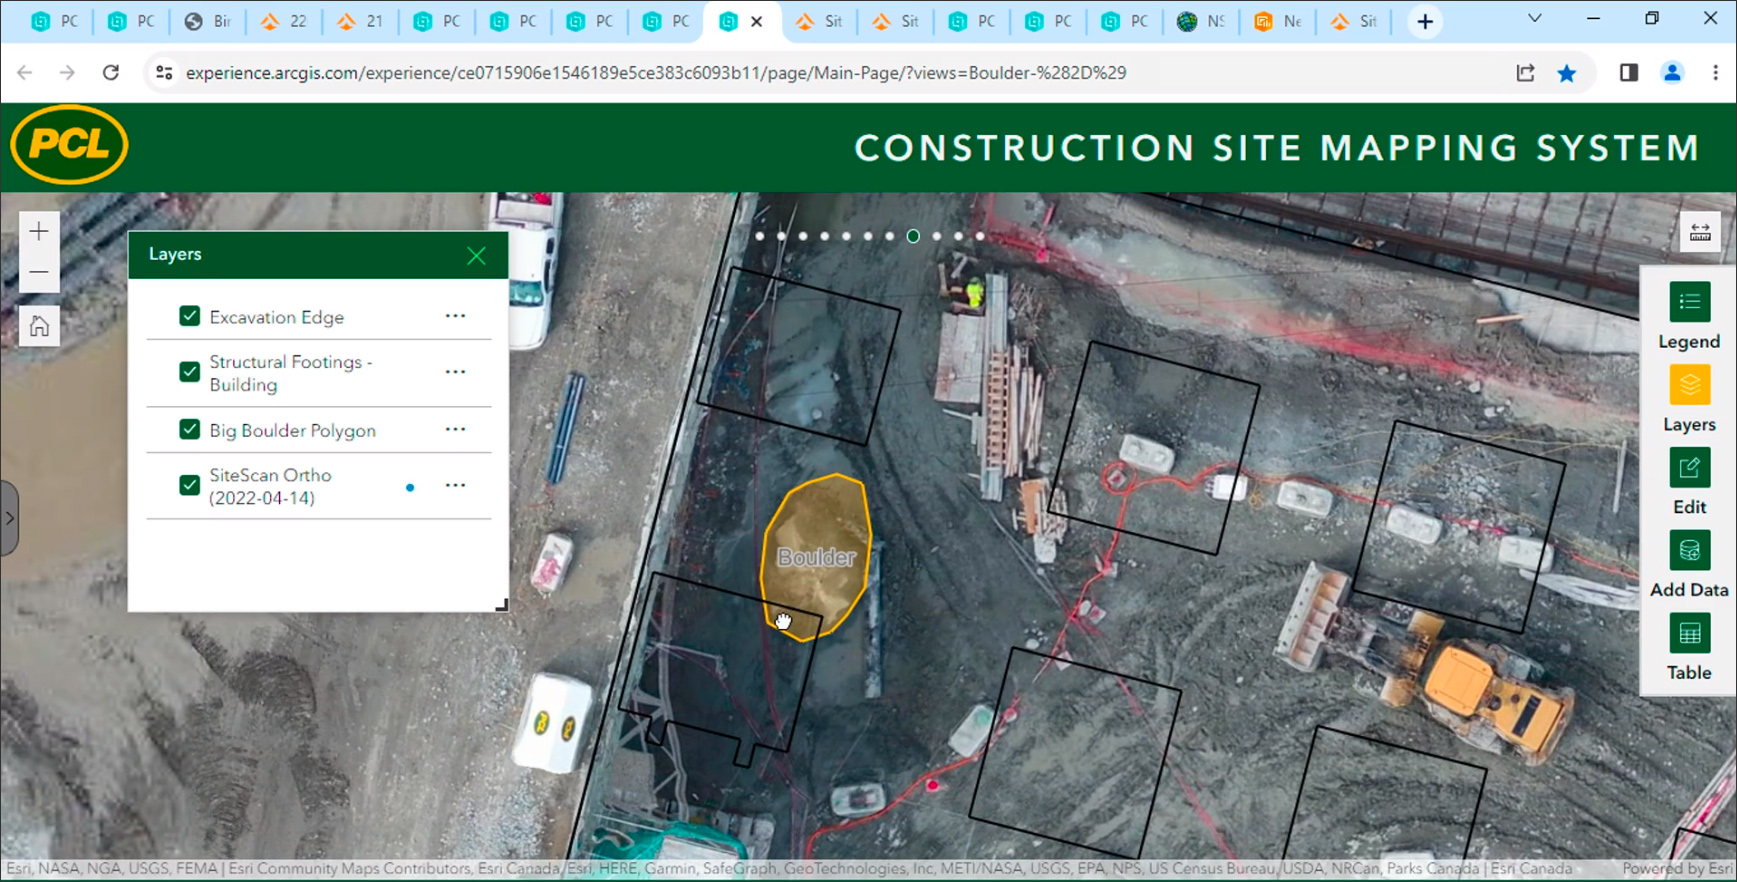
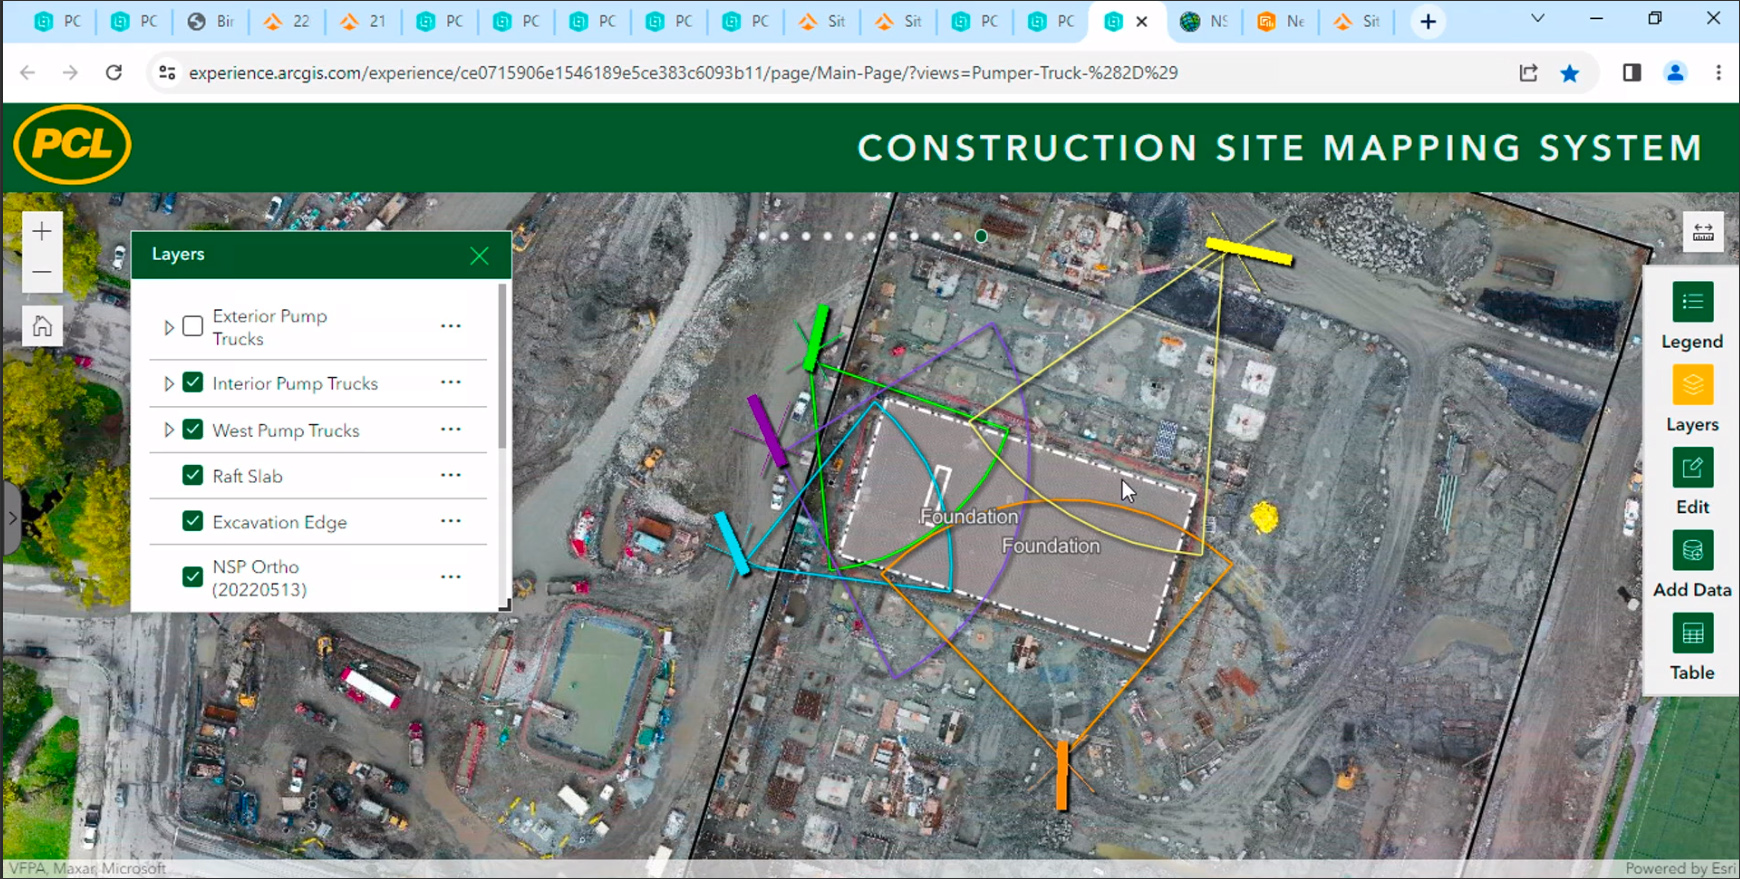
A few examples presented by PCL Construction to highlight the benefits of using the ArcGIS site map on the project are shown in Figure 5. In one instance, the team was able to detect a potential conflict between the foundation of a construction crane and the building of a ramp, and it was able to re-position the ramp to avoid the conflict well in advance. In another example, a boulder the size of a pickup truck was discovered in the same location as one of the foundations and needed to be excavated. By mapping out the boulder, PCL could calculate its exact volume for removal to convey to the subcontractor. And finally, when it came time to pour concrete for the giant main foundation, the site map was used to plan the position of the 550 cement trucks that would be coming in to pour the concrete for 12 hours nonstop, allowing the work to proceed with precision and accuracy on the day of the cement pour.
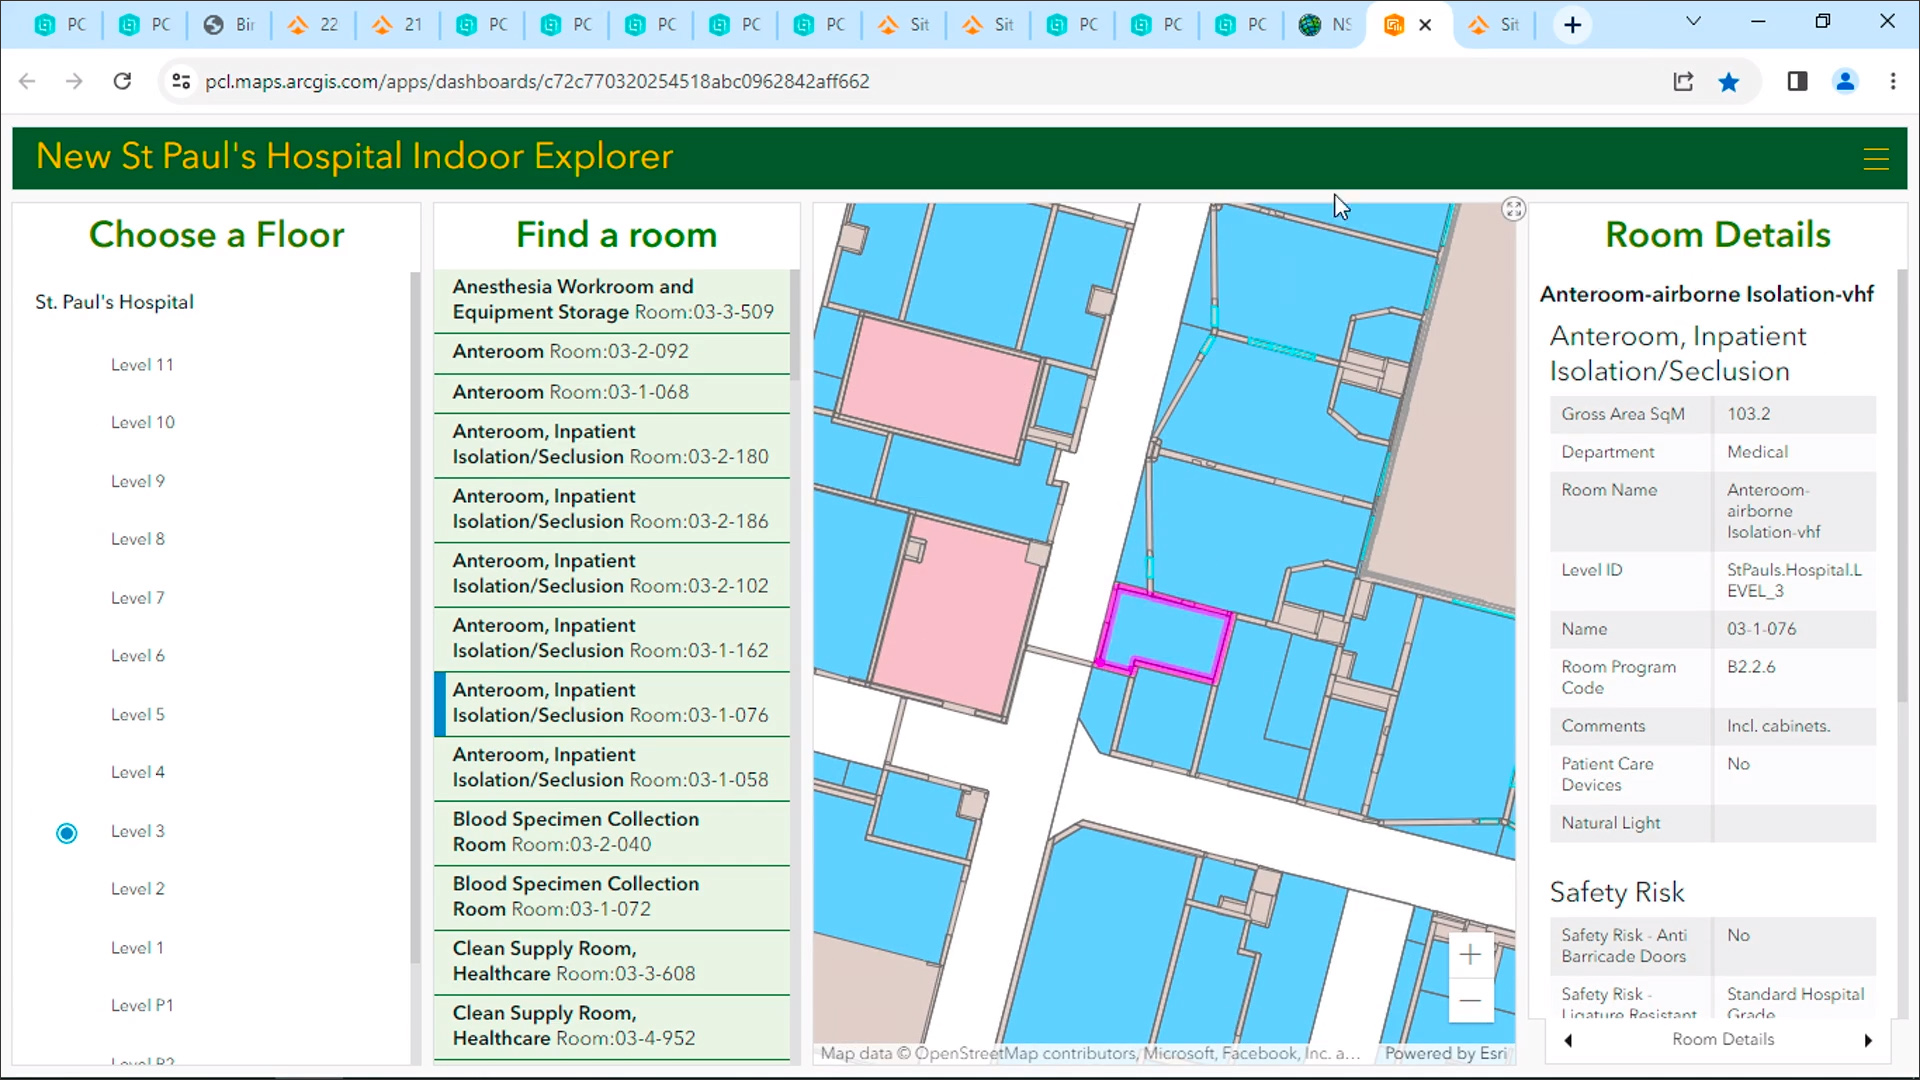
As part of its contract, PCL Construction will also be delivering an indoor GIS of the project for the digital handover to its owner, Providence Health. Created with the ArcGIS Indoors application, the digital delivery will include all the asset and equipment attributes that will be required to effectively operate the hospital, tied to its BIM model (Figure 6). The BIM model, in turn, will be created by integrating the design and construction models to provide accurate asset locations. As construction on the project is still underway, PCL Construction is collecting the required as-constructed asset and attributed data as it is being built.
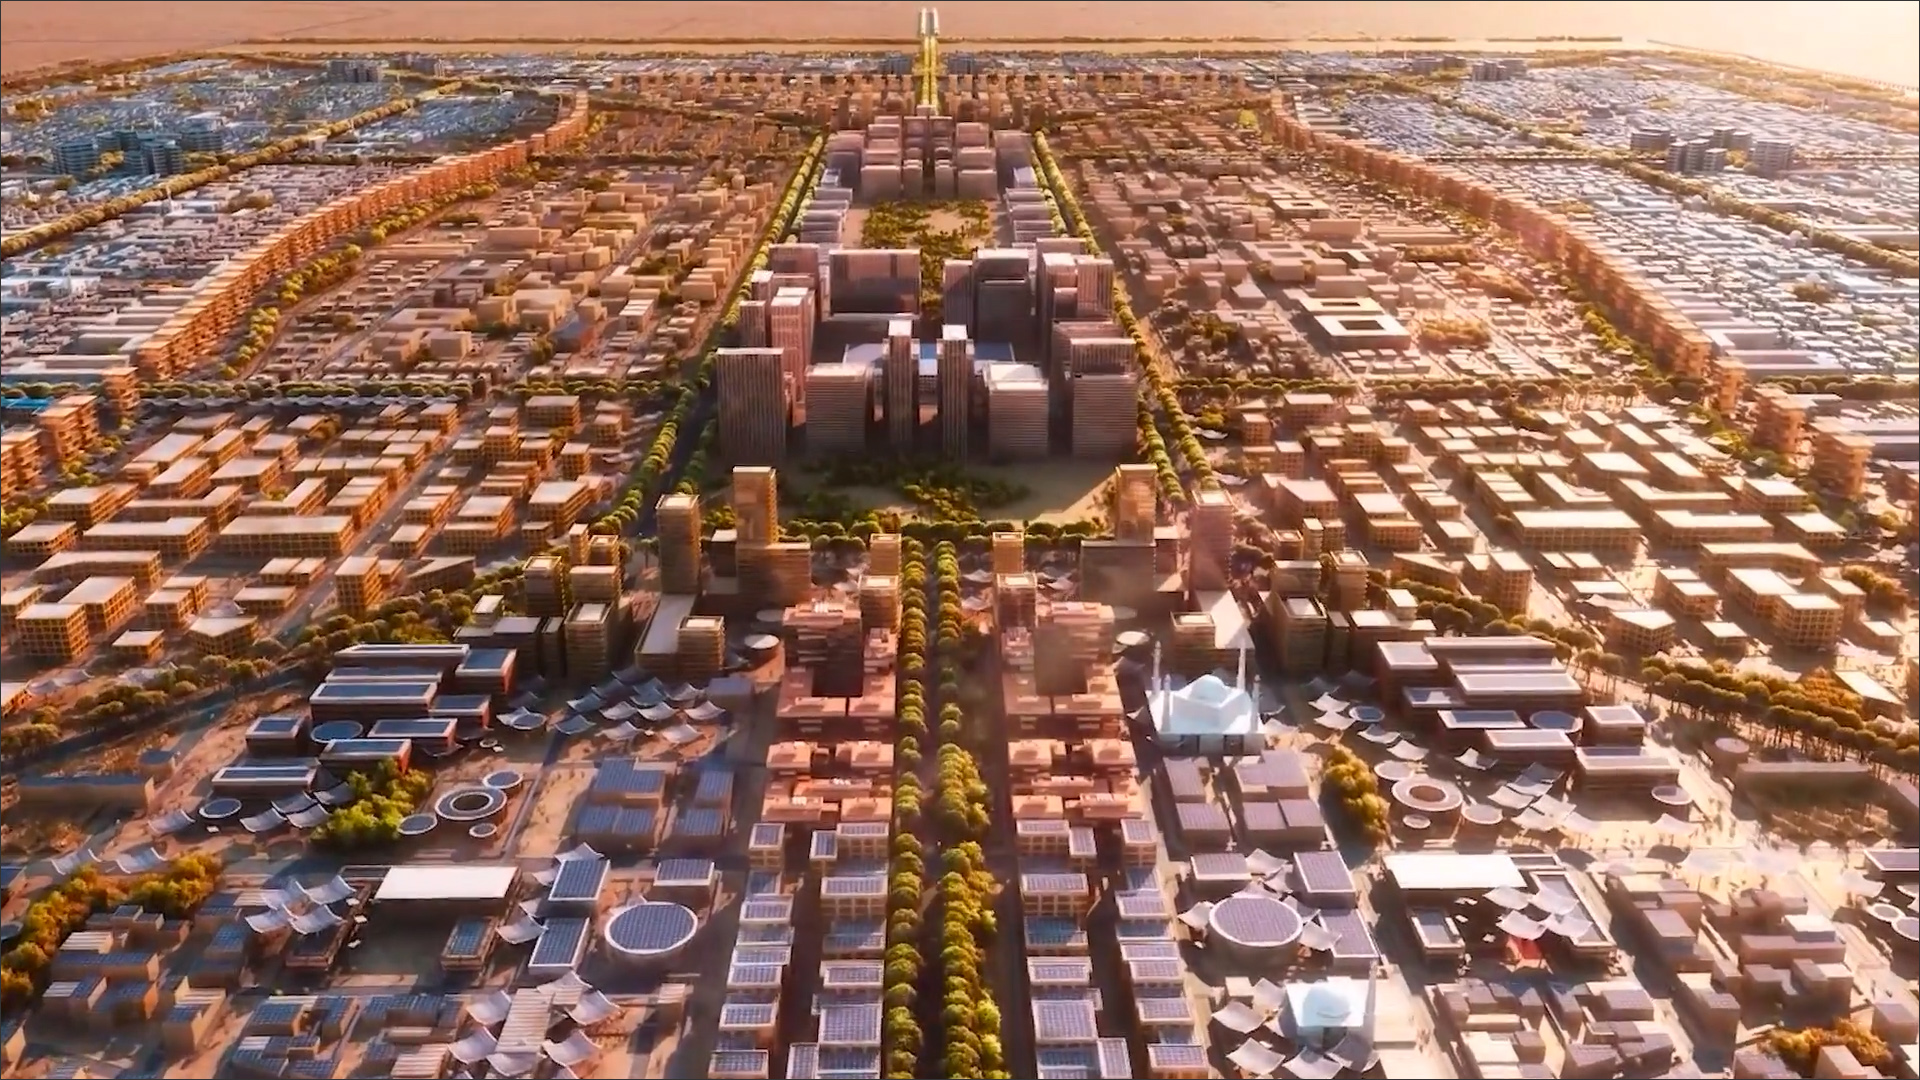
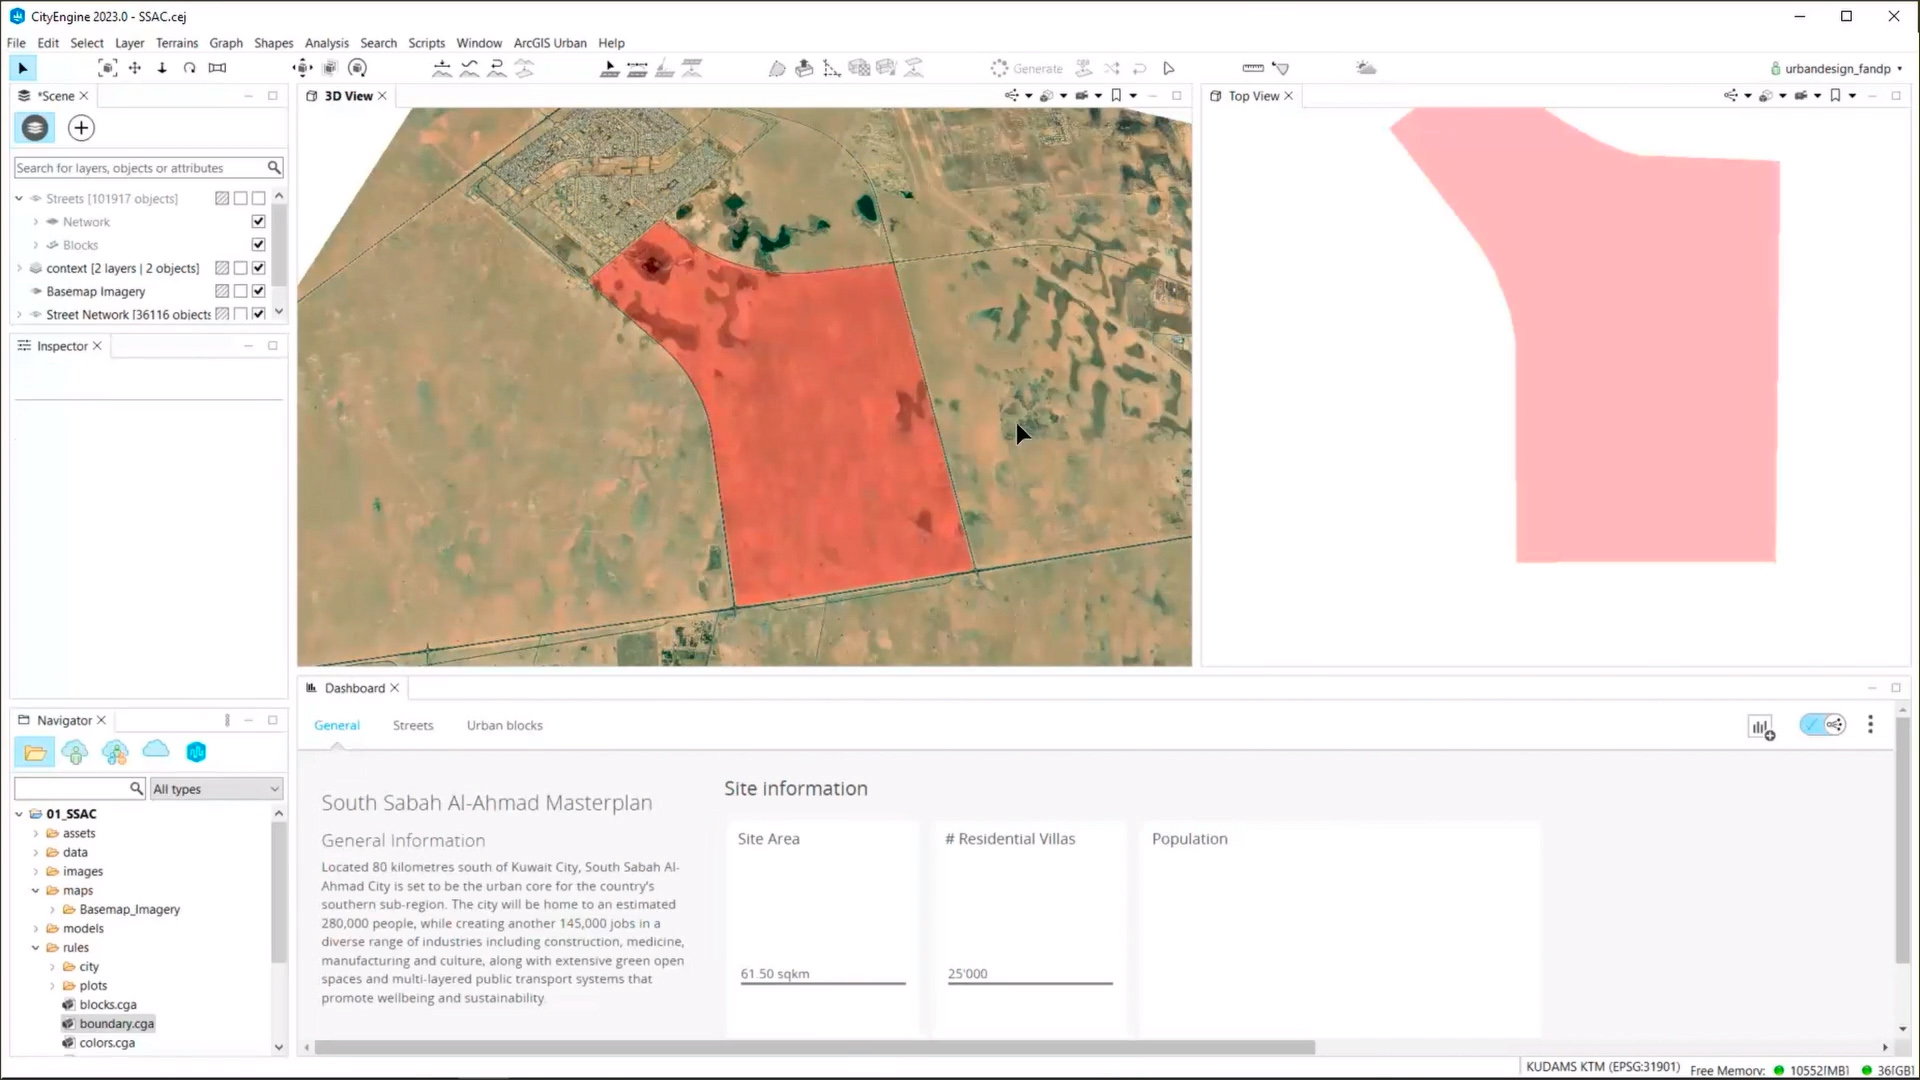
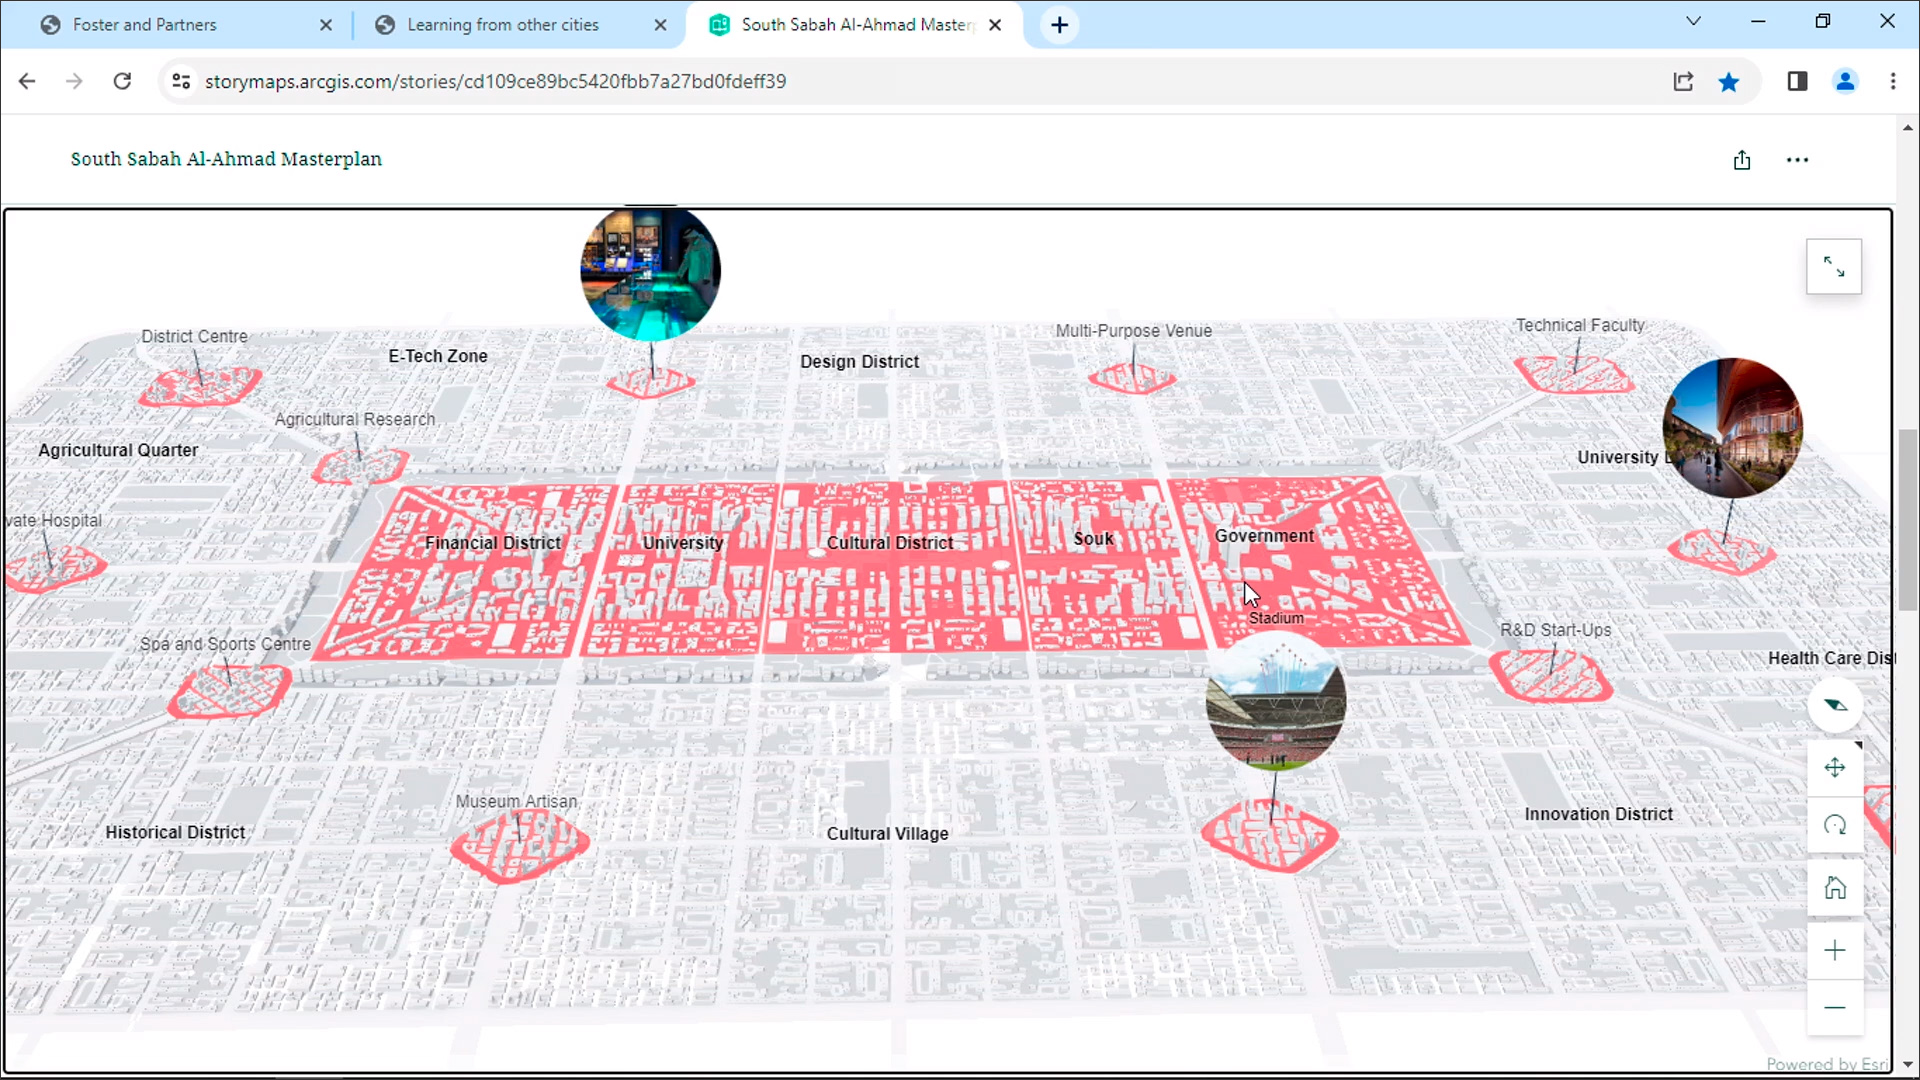
One of the leading design firms in the world, Foster + Partners, showed how it was using ArcGIS for the urban design of a brand-new city being planned in Kuwait called South Sabah Al-Ahmad. This city, spanning a site of 24 square miles, will be home to an estimated 280,000 people and is set to be the urban core for the country’s southern sub-region, creating another 145,000 jobs in a diverse range of industries including construction, medicine, manufacturing, and culture. The design concept by Foster + Partners (shown in Figure 7) creates ten neighborhood clusters arranged around the city’s central business district, bordered by a ring of light industrial buildings. The central district contains a sports stadium, museum, city university and a major city park, with extensive green open spaces and multi-layered public transport systems throughout the city.
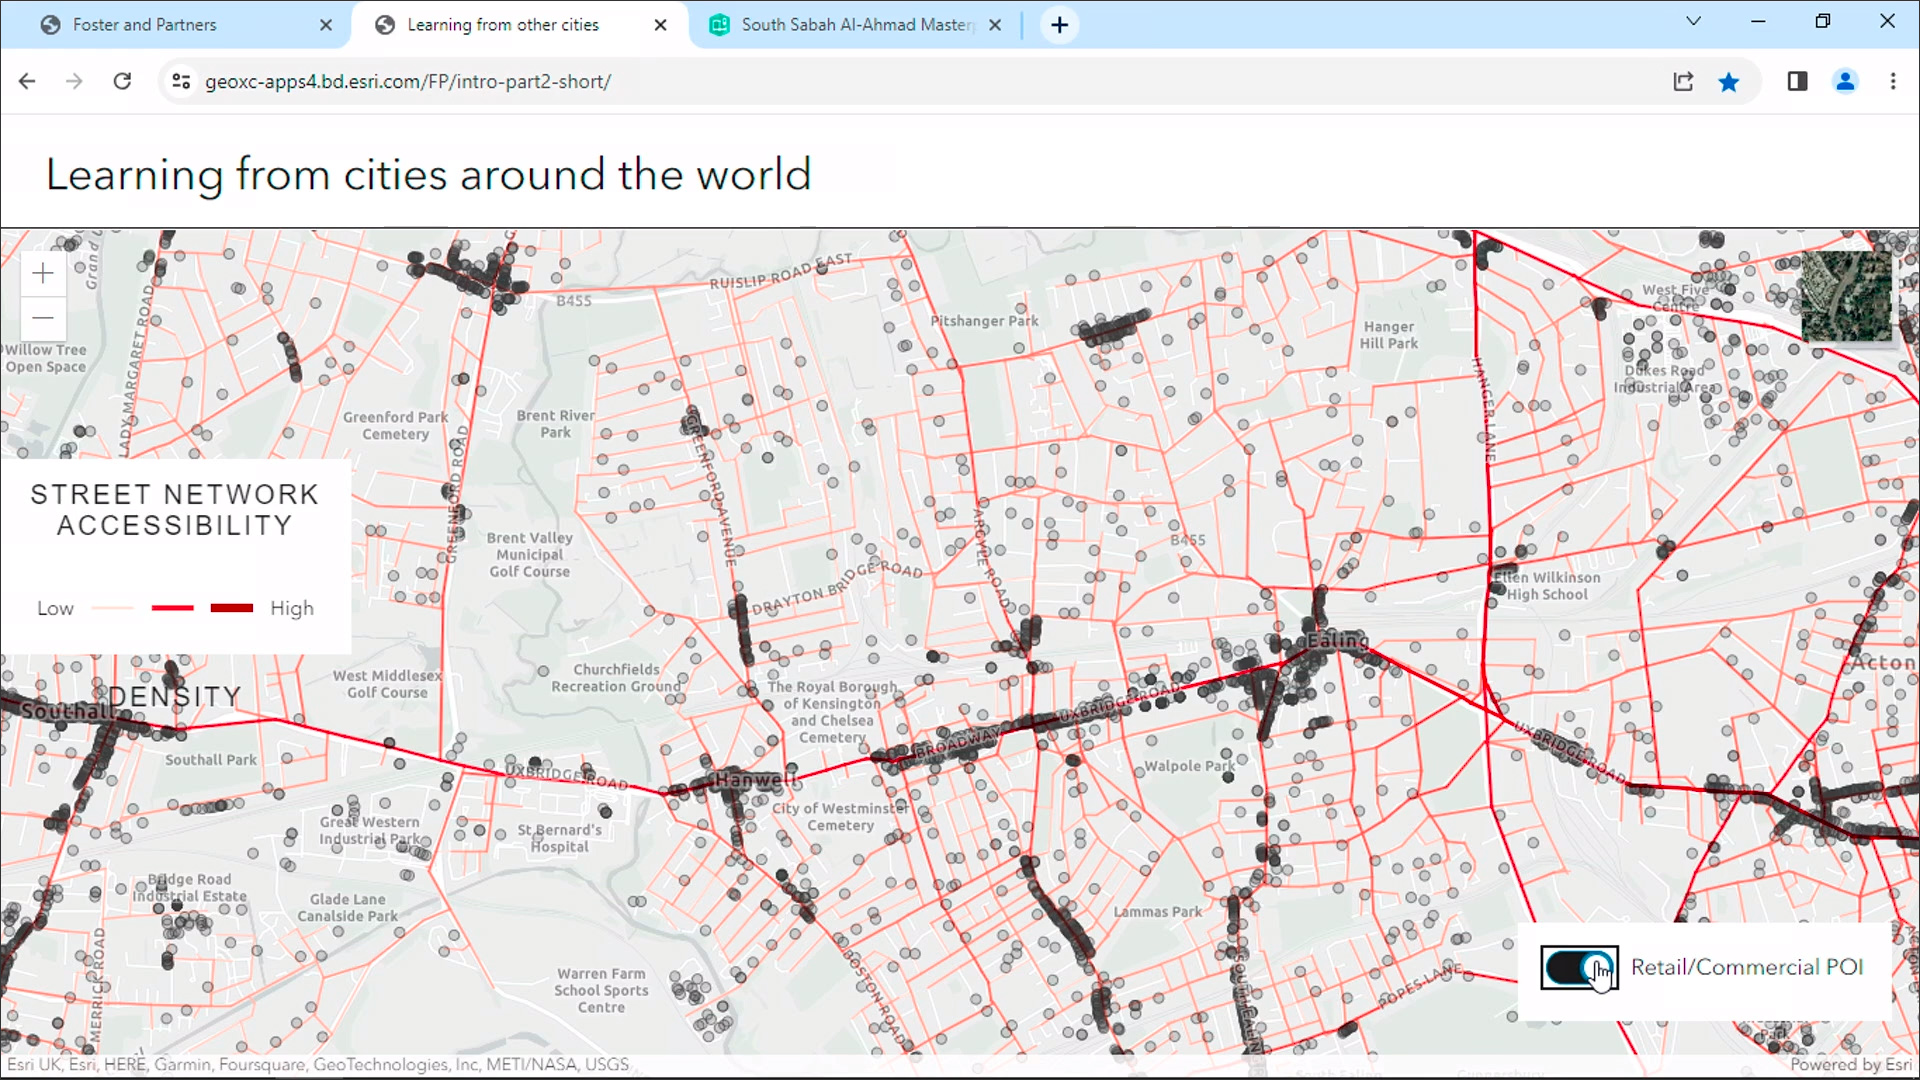
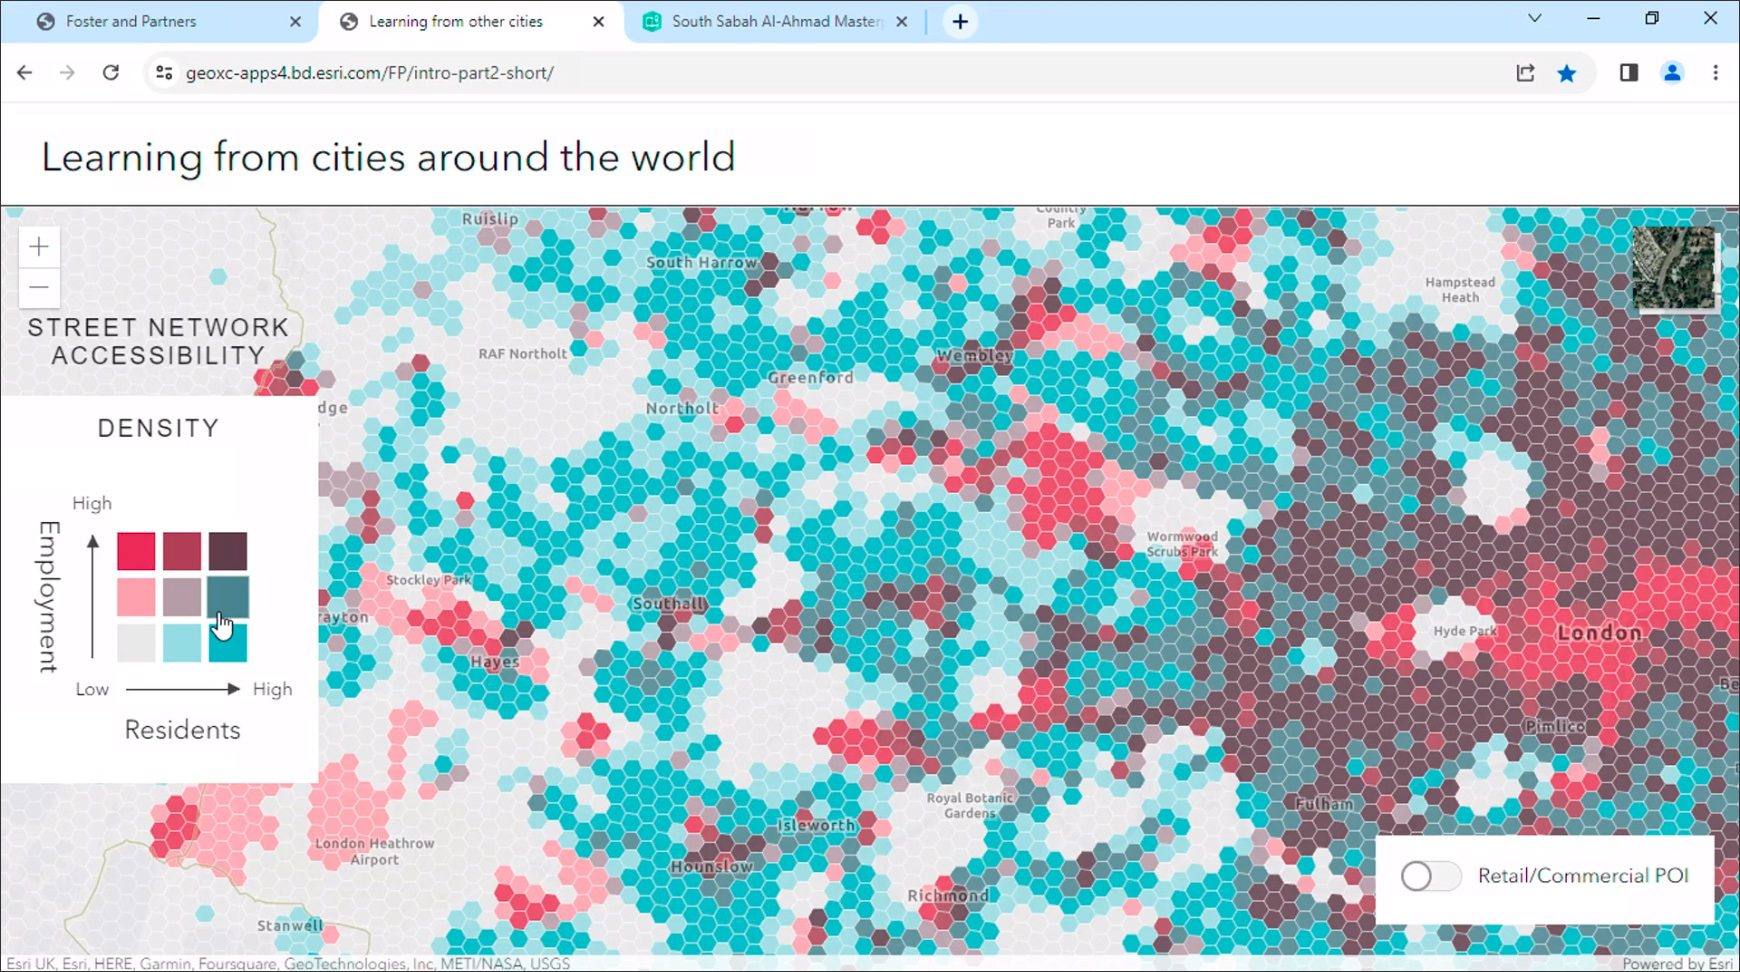
In order to design the city, the firm researched other major cities around the world with the help of ArcGIS to understand aspects like street network accessibility, the patterns between the locations of businesses and the clustering along the main transportation arteries, the relationship between density and urban form, the building typologies for a specific density, and so on. These kinds of analyses help the urban design team at Foster + Partners to better understand the patterns, relationships, and forces that shape existing cities, so that they can make more informed decisions when designing new cities like South Sabah Al-Ahmad that can successfully meet their objectives and are also sustainable and livable.
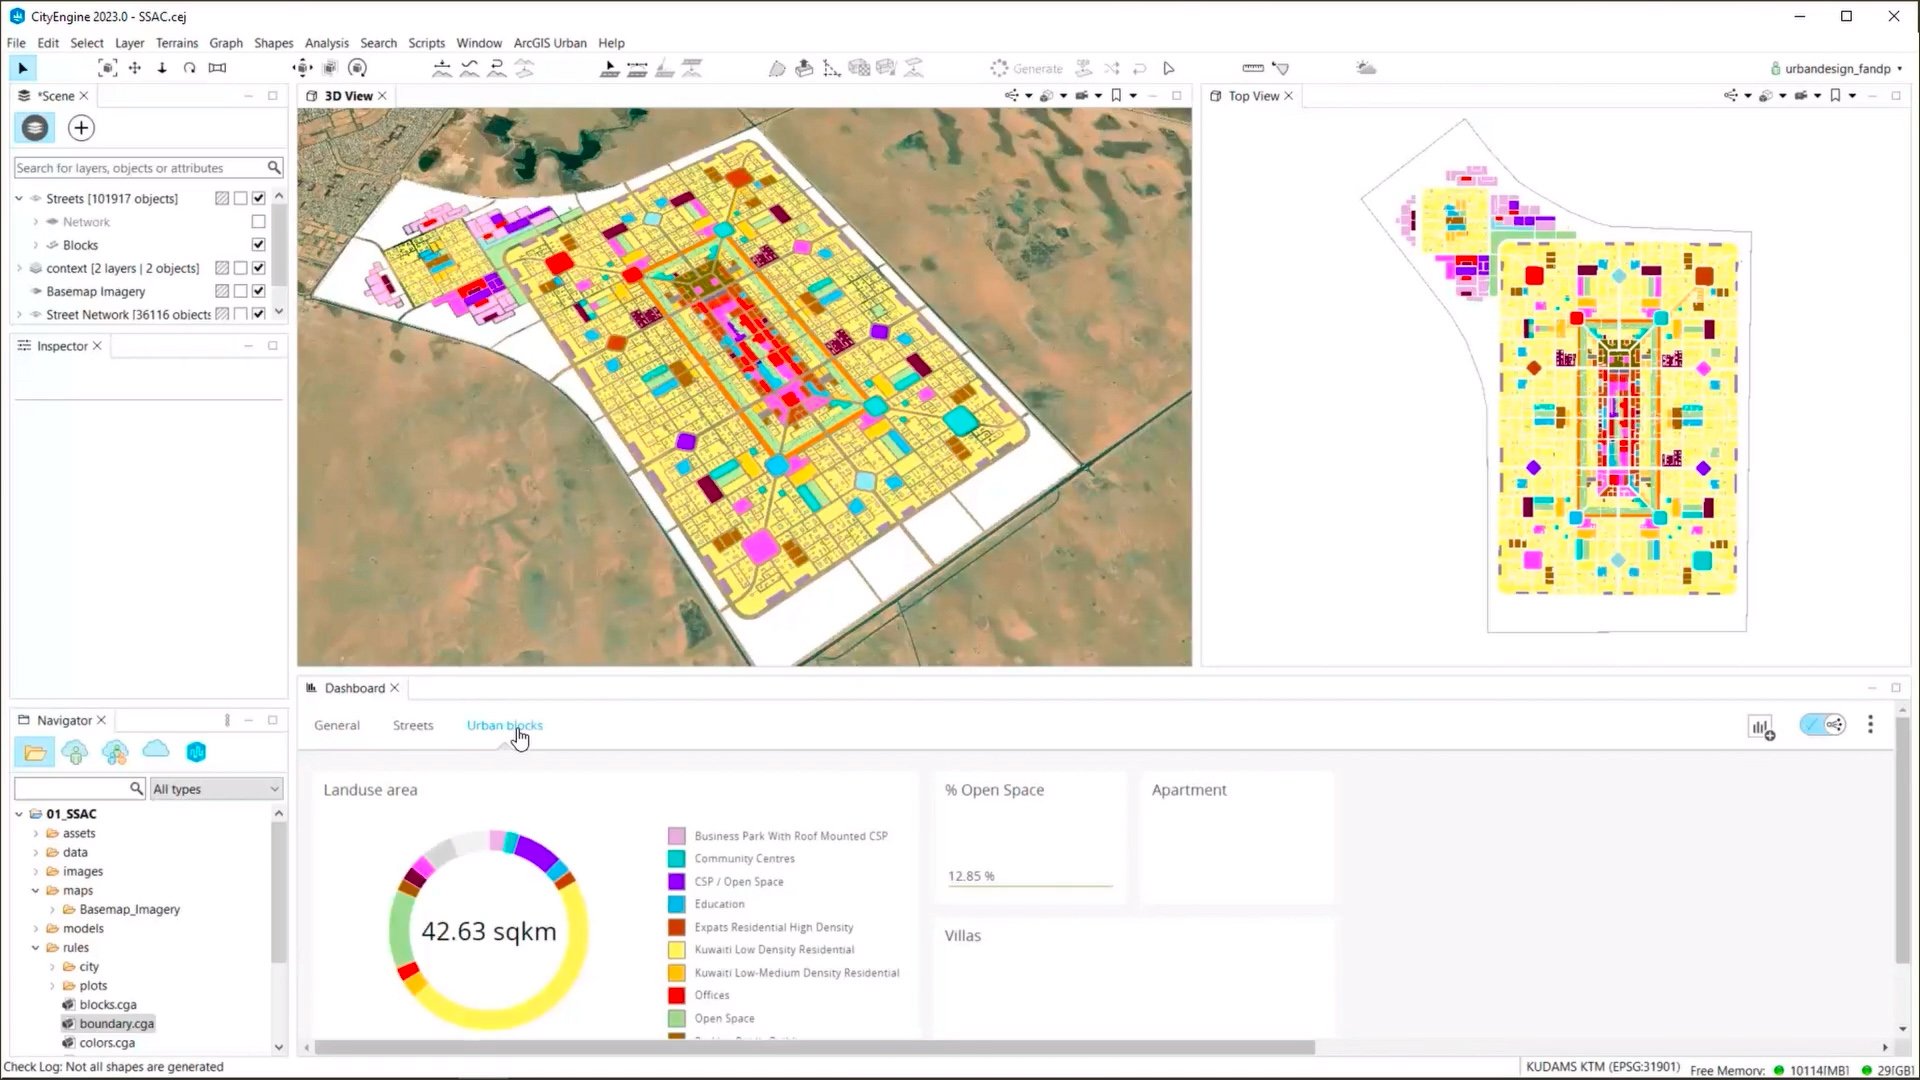
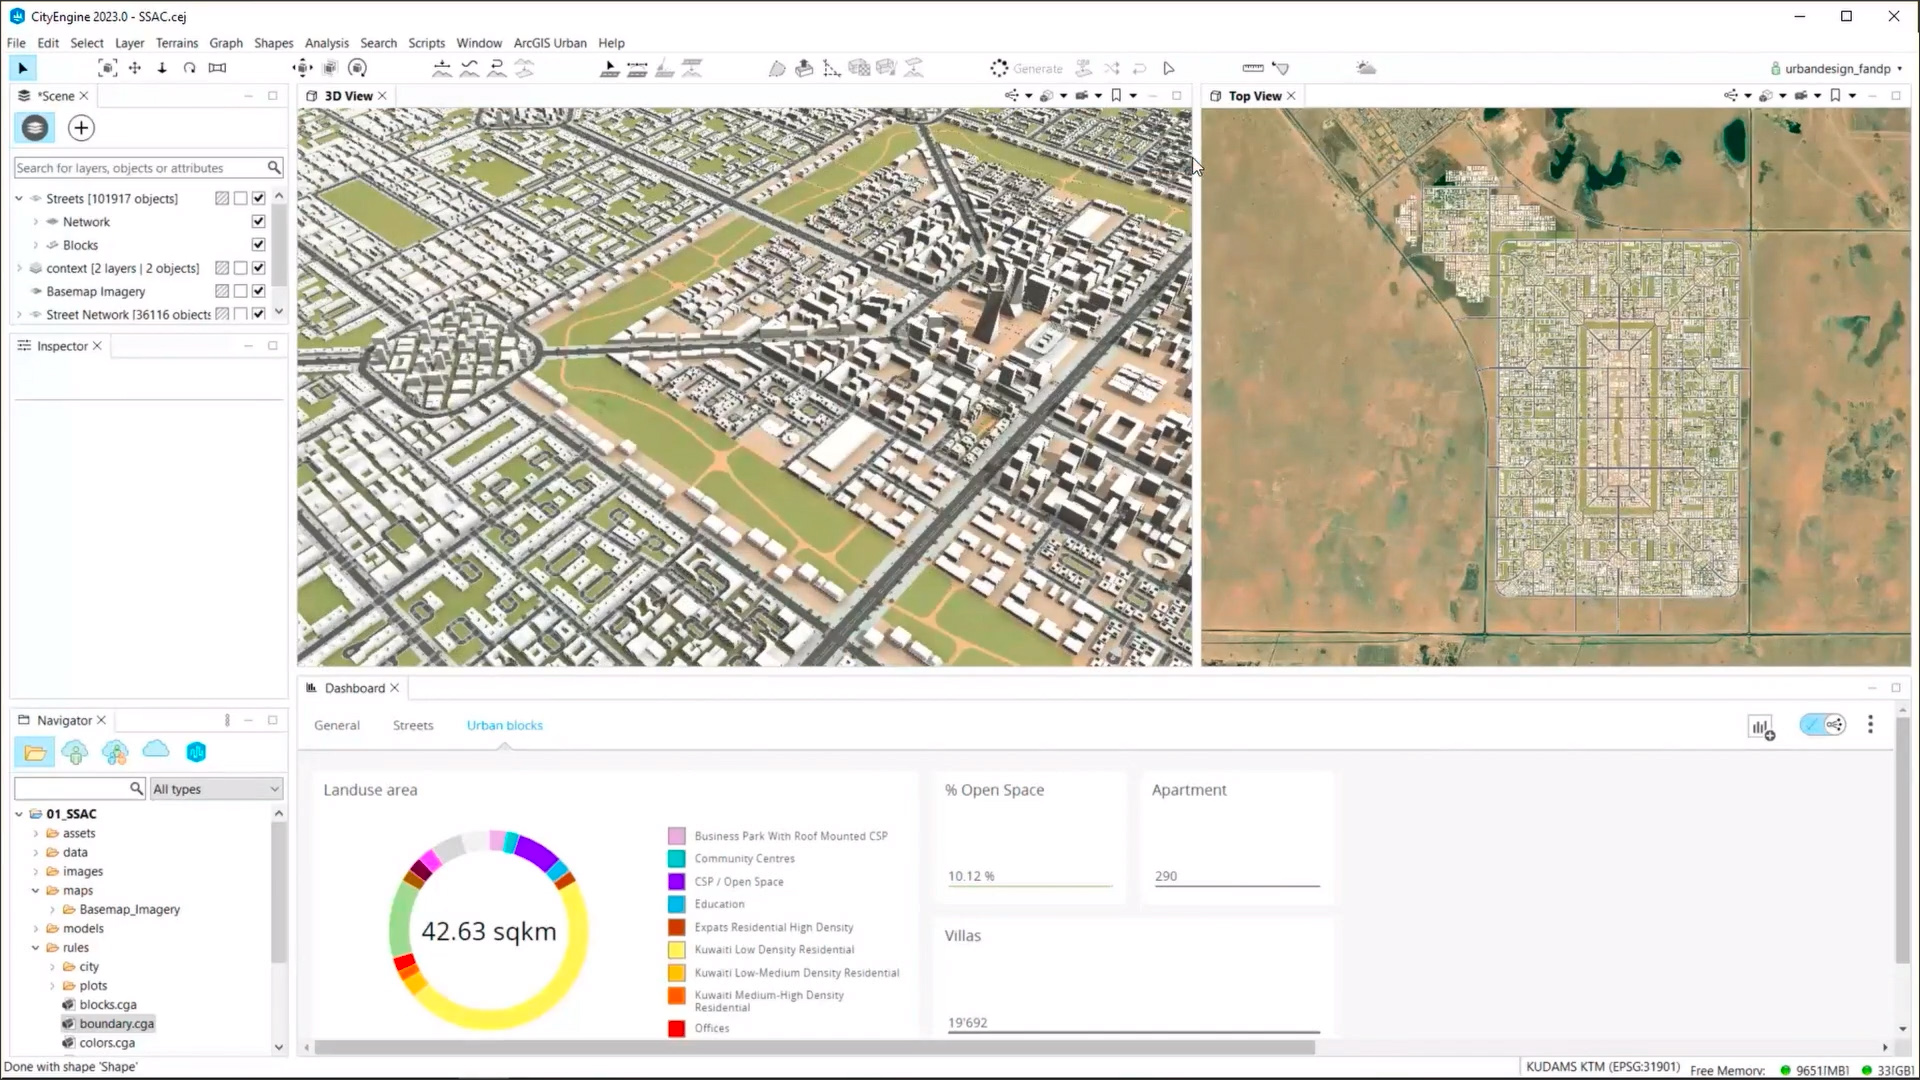
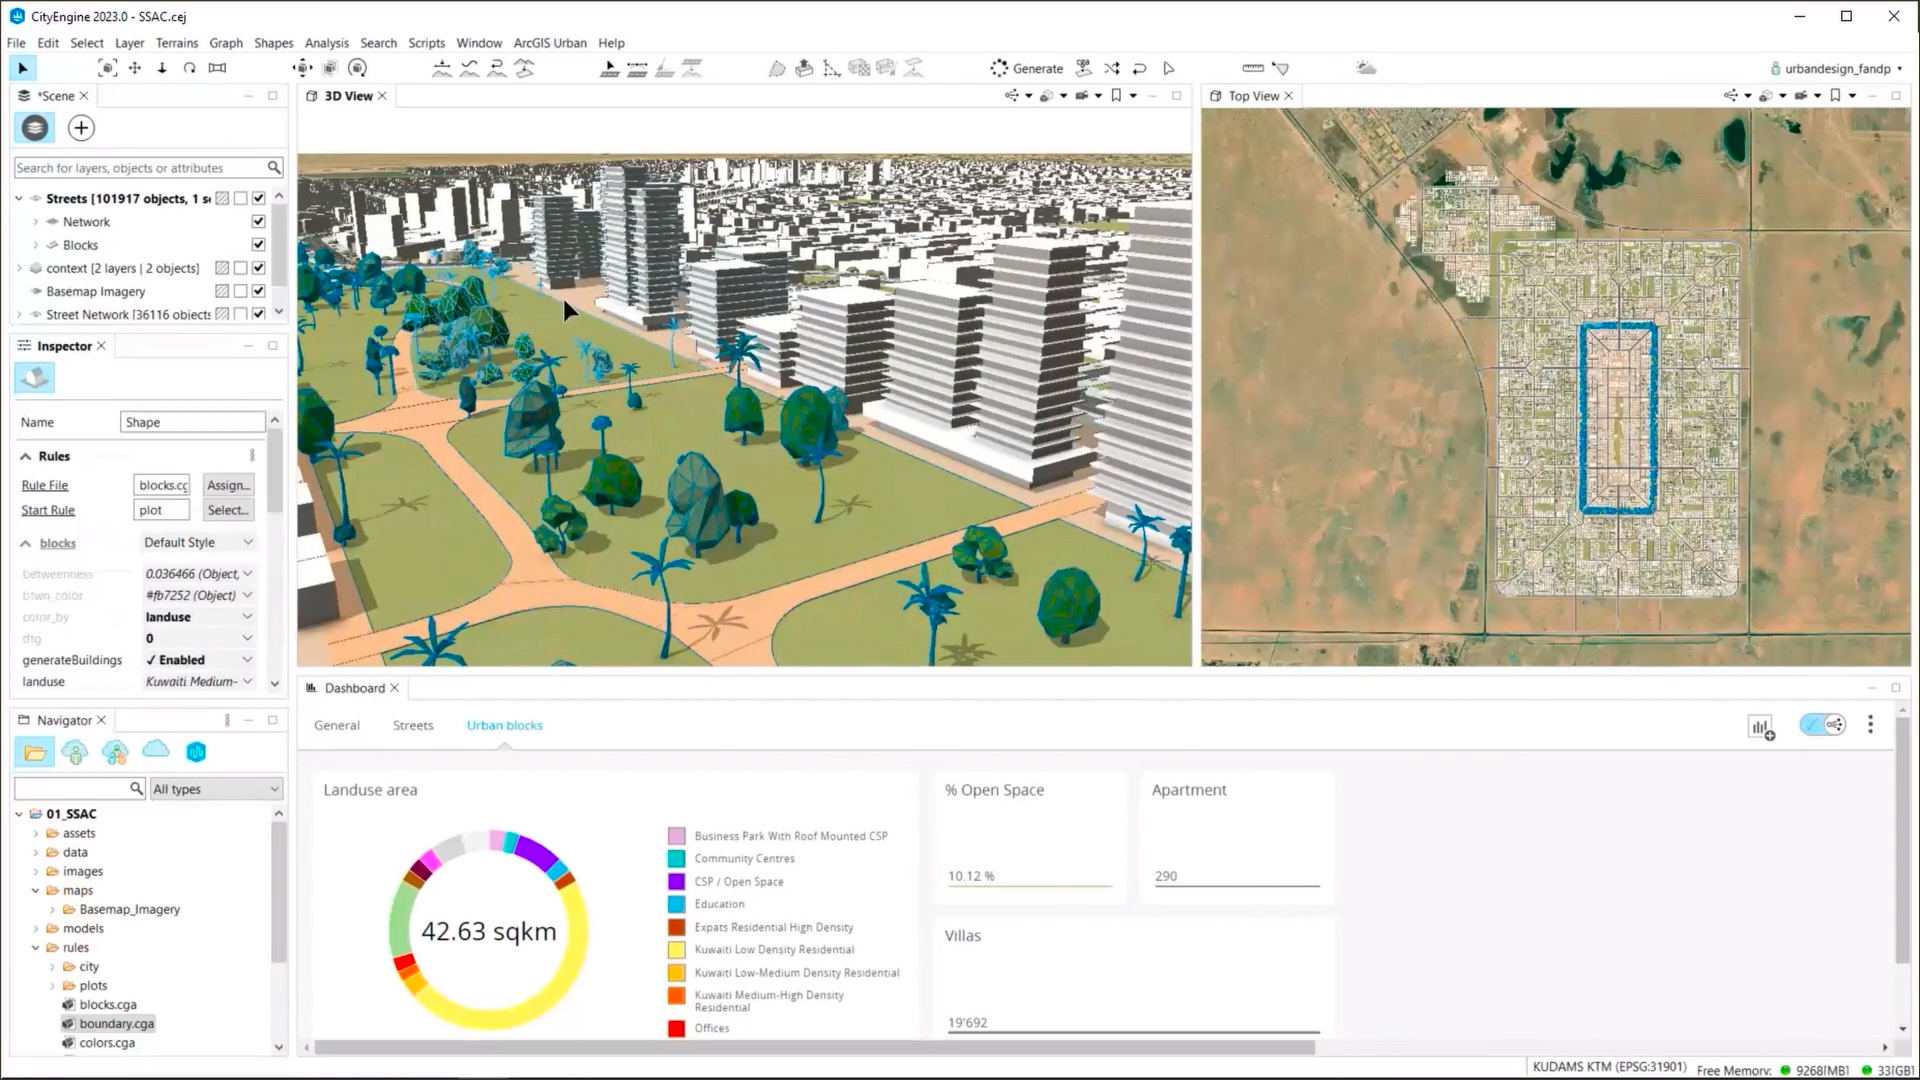
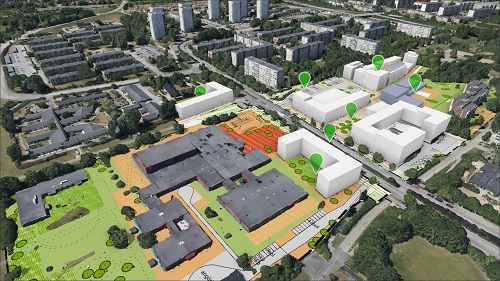
Armed with this research and the understanding resulting from it, the team at Foster + Partners used ArcGIS City Engine to design the masterplan for the new city in Kuwait (Figure 9), starting from understanding the geography of the site and the constraints it imposed, laying out the roads and streets, zoning for different land uses including open spaces, creating climate-responsive structures for the different building types, designing parks and placing vegetation to provide shade, and importing BIM models of some of the individual buildings to provide detail.
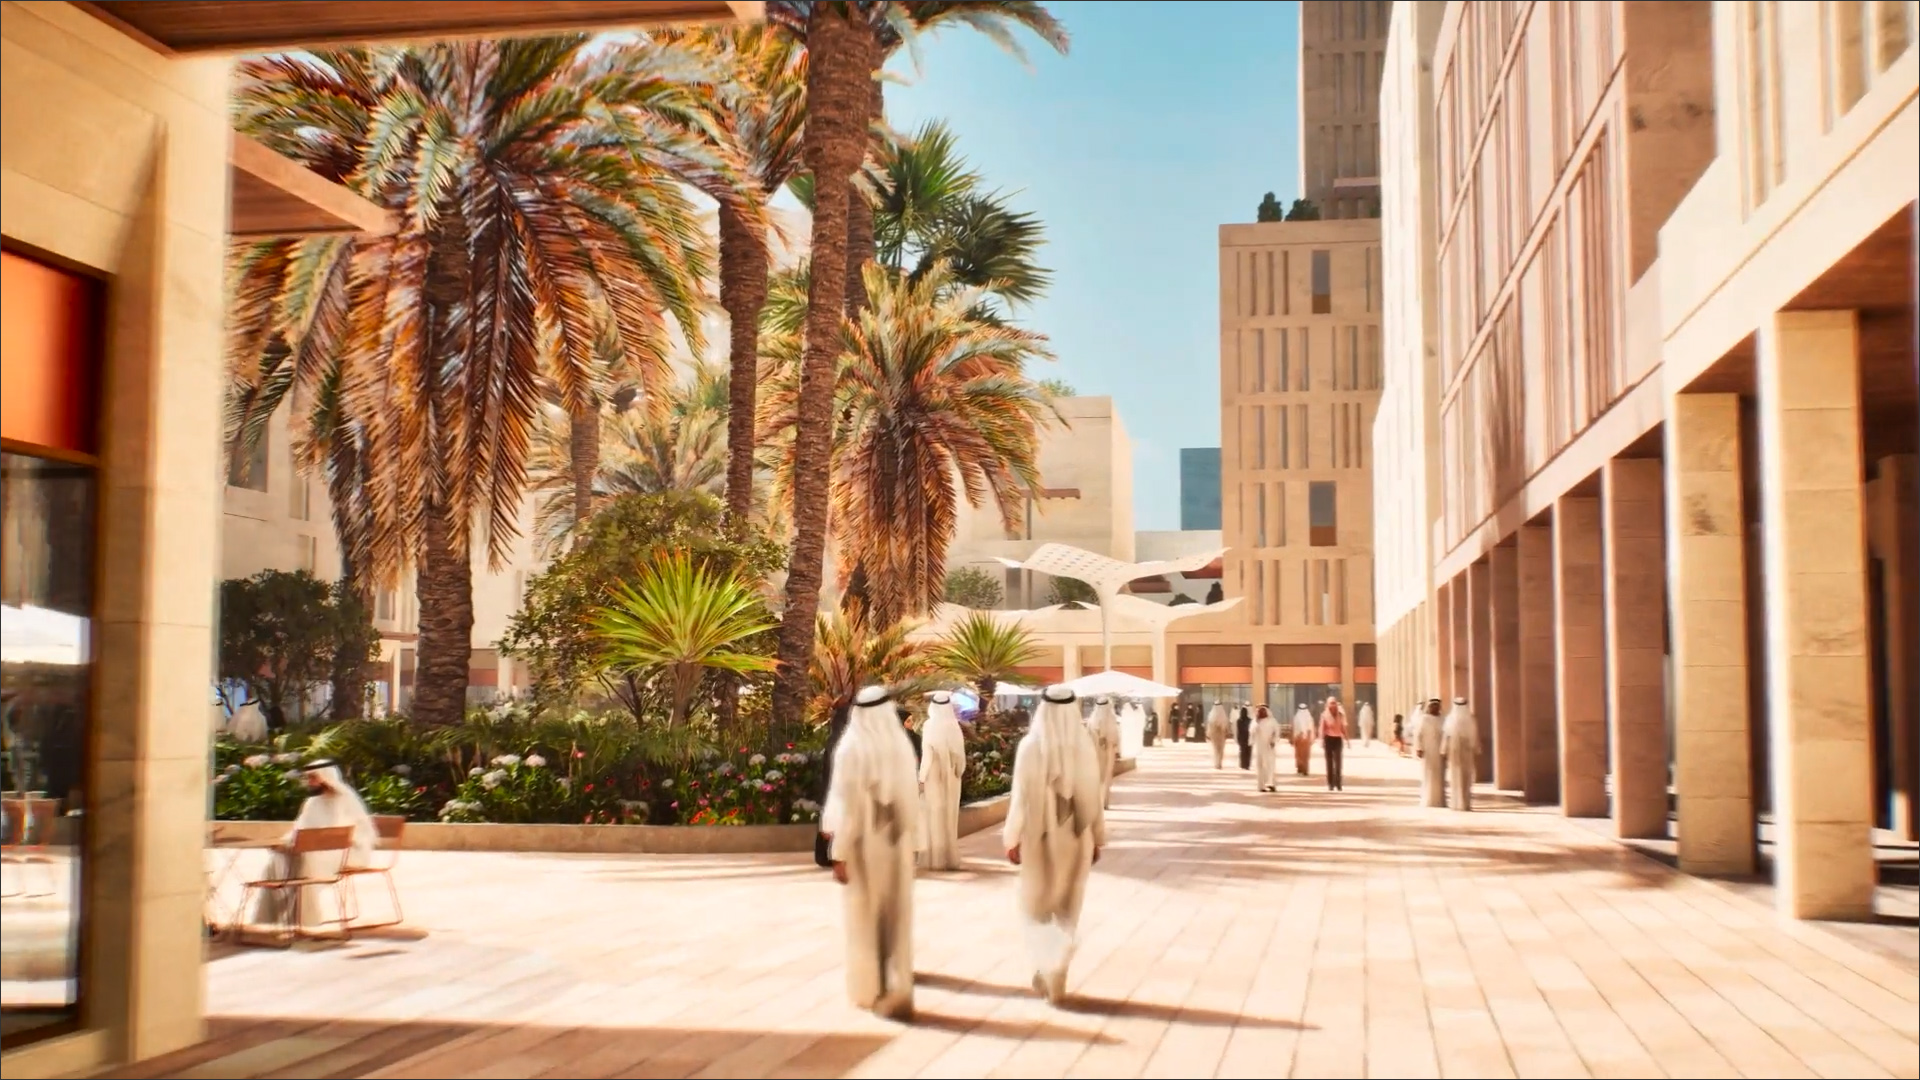
The design of the city was shared with the client by directly exporting the model from CityEngine to a web scene that could be navigated in a browser. The web scenes were also embedded in multiple story maps, also part of ArcGIS, with additional overlays to explain the concept (Figure 10). It was possible to zoom into any area of the web scene and be able to walk through the development. And finally, any City Engine scene could be exported to Unreal Engine where materials, people, and other entourage were added to allow the design to be explored photorealistically by the client in a gaming environment in real-time.
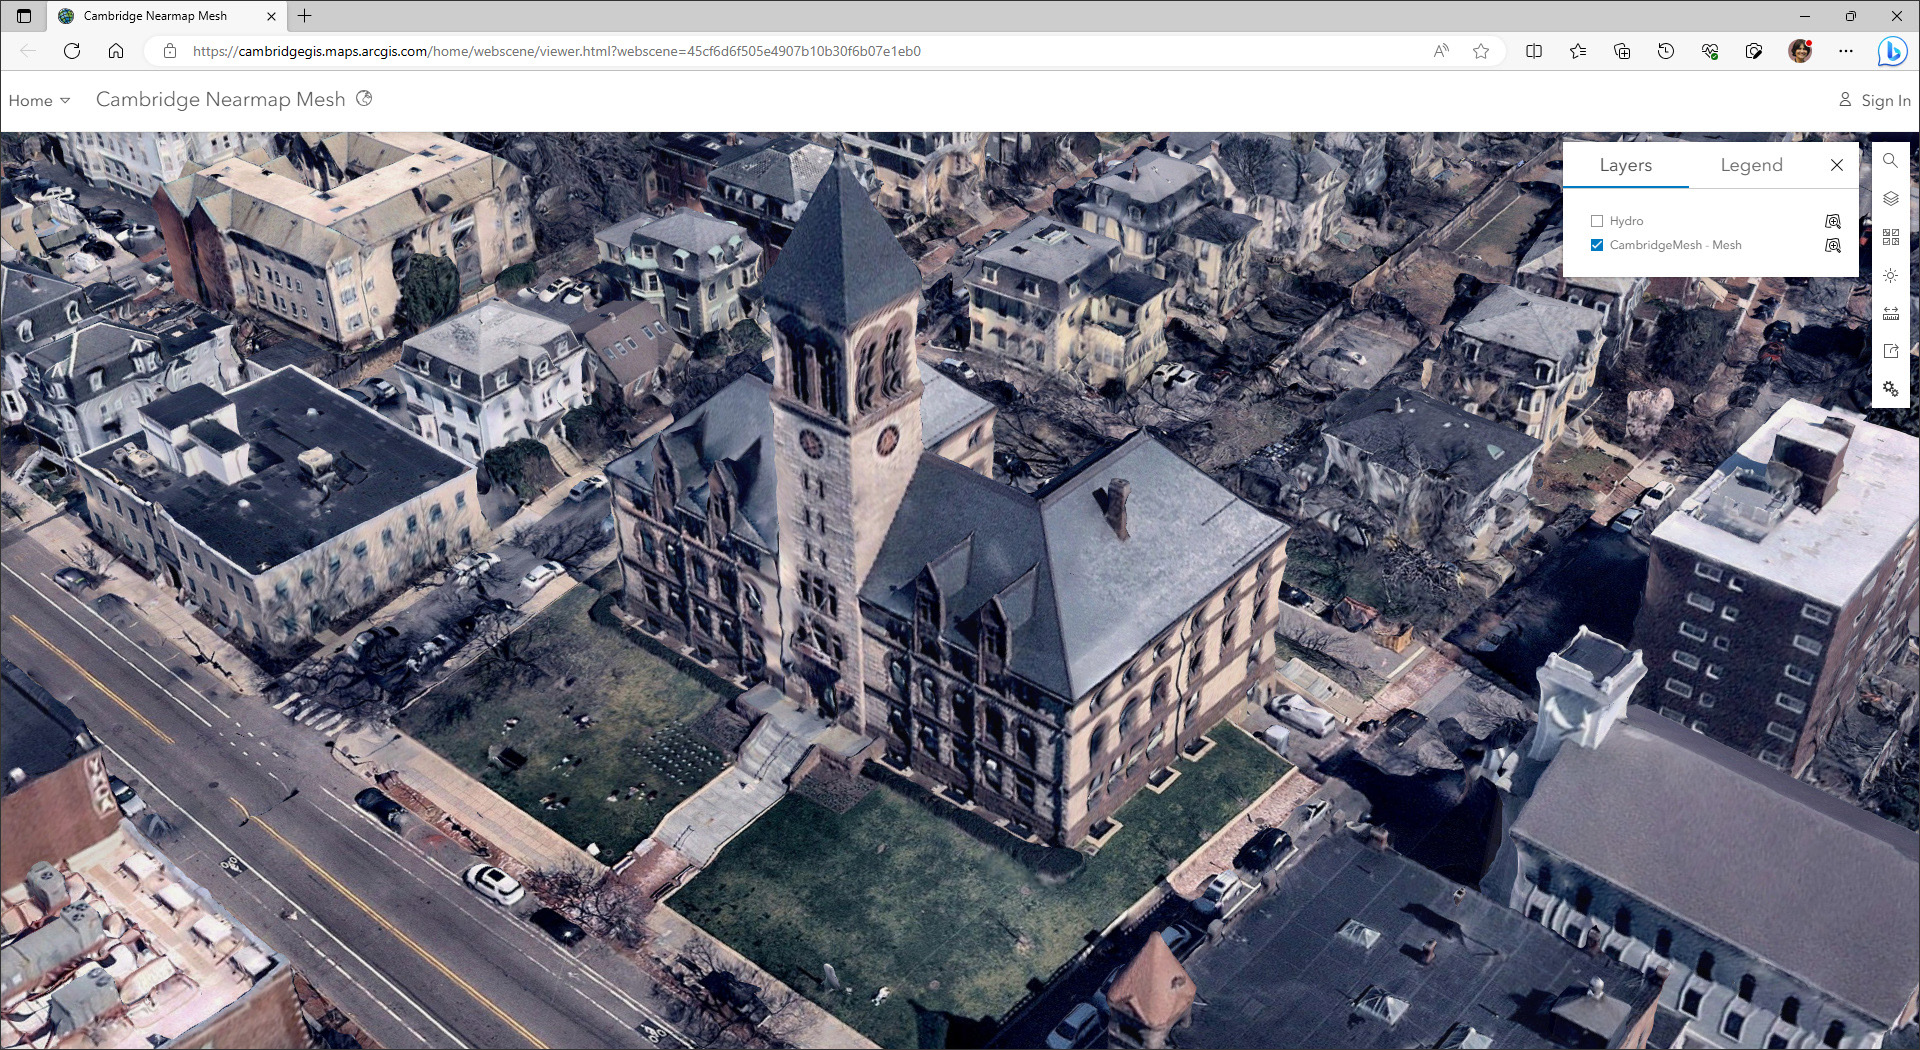
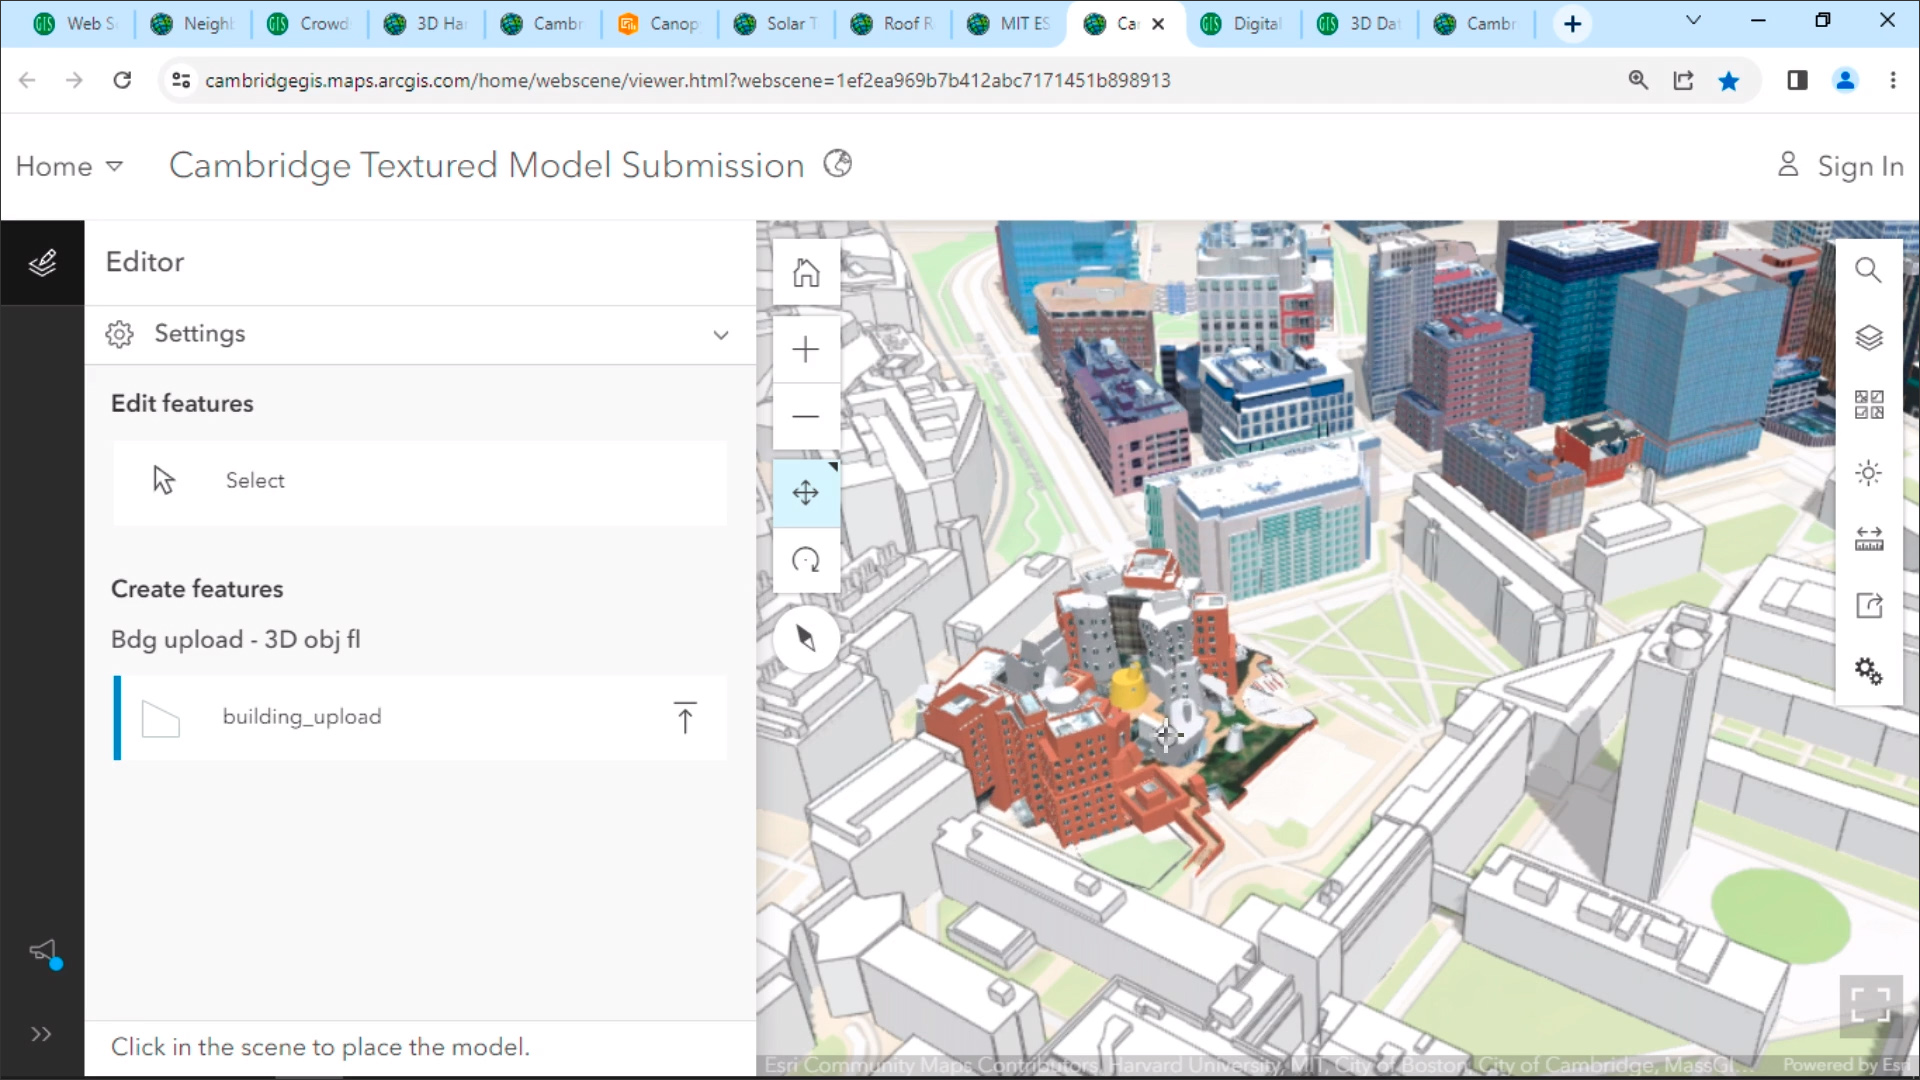
The city of Cambridge is one of the most densely populated, built-out cities in the United States, and it has a well-established GIS program that uses ArcGIS to create a citywide 3D model that can be used by residents, urban designers, architects, and city staff for visualization, design, analysis, and planning. It can be accessed by anyone via a web browser, as shown in Figure 11. Additional 3D variations of the model are also available as ArcGIS web scenes to browse, including a version integrated with a reality mesh of the entire city as well as a version with textured buildings.
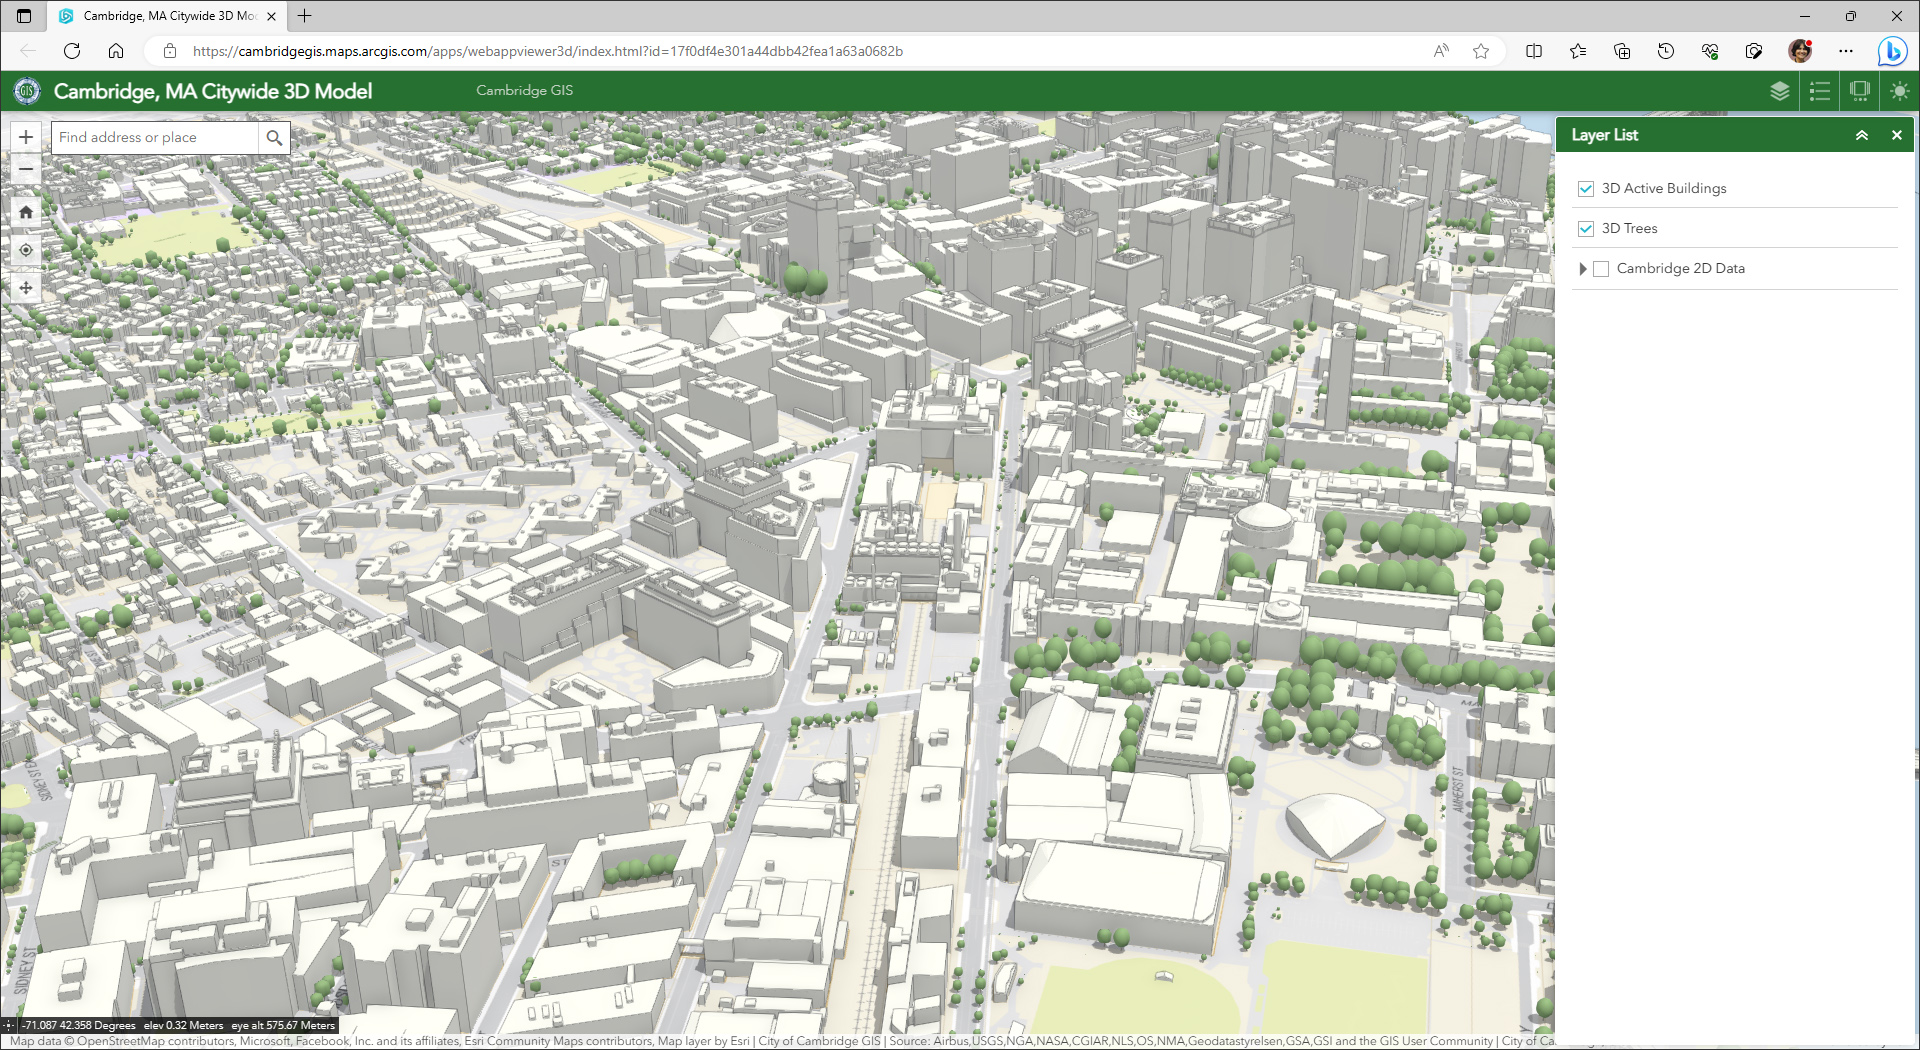
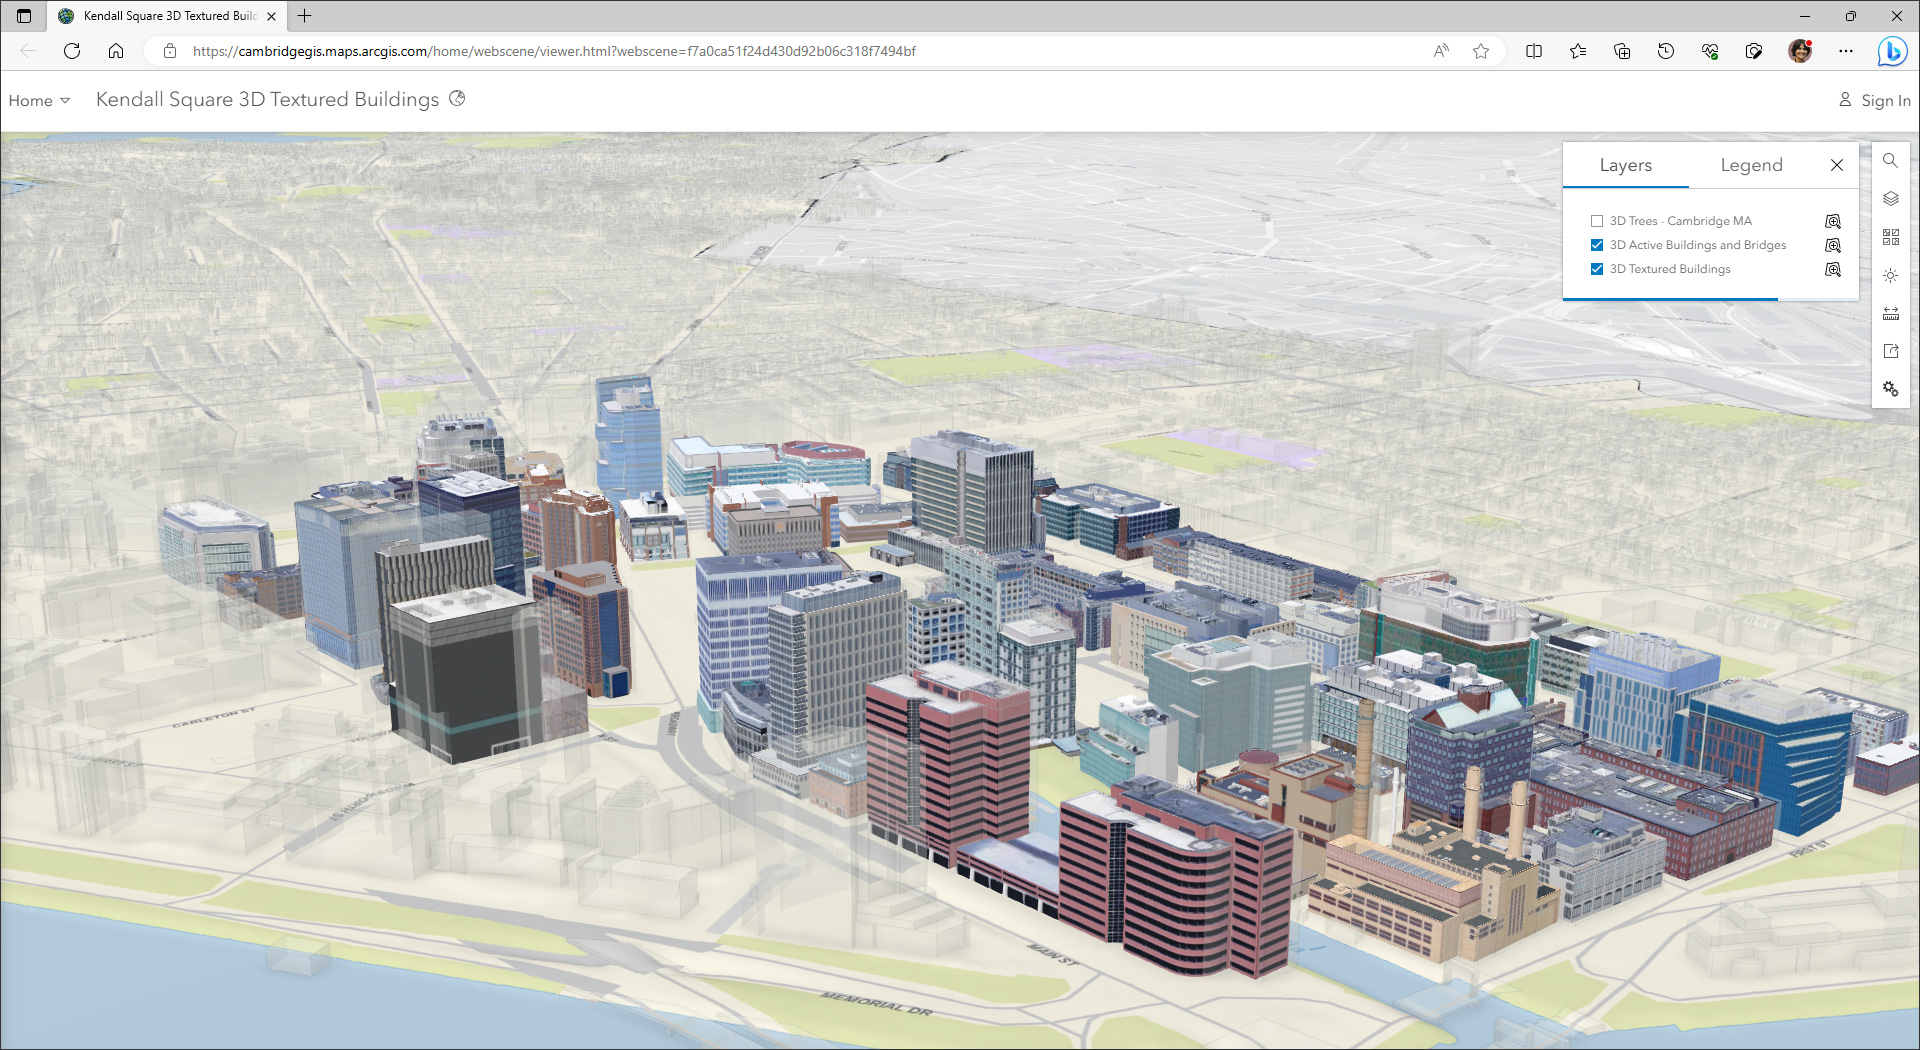
All of this available 3D data, which includes digital representations of buildings, terrain, and site plans for the city, is available for download in various formats like SketchUp and OBJ and can be used to provide designers with a rich context model for their designs and provide residents with updates of existing and future developments in the city. The city also solicits submissions of digital 3D building models for new construction projects, which allows the city model to be kept accurate and up-to-date.
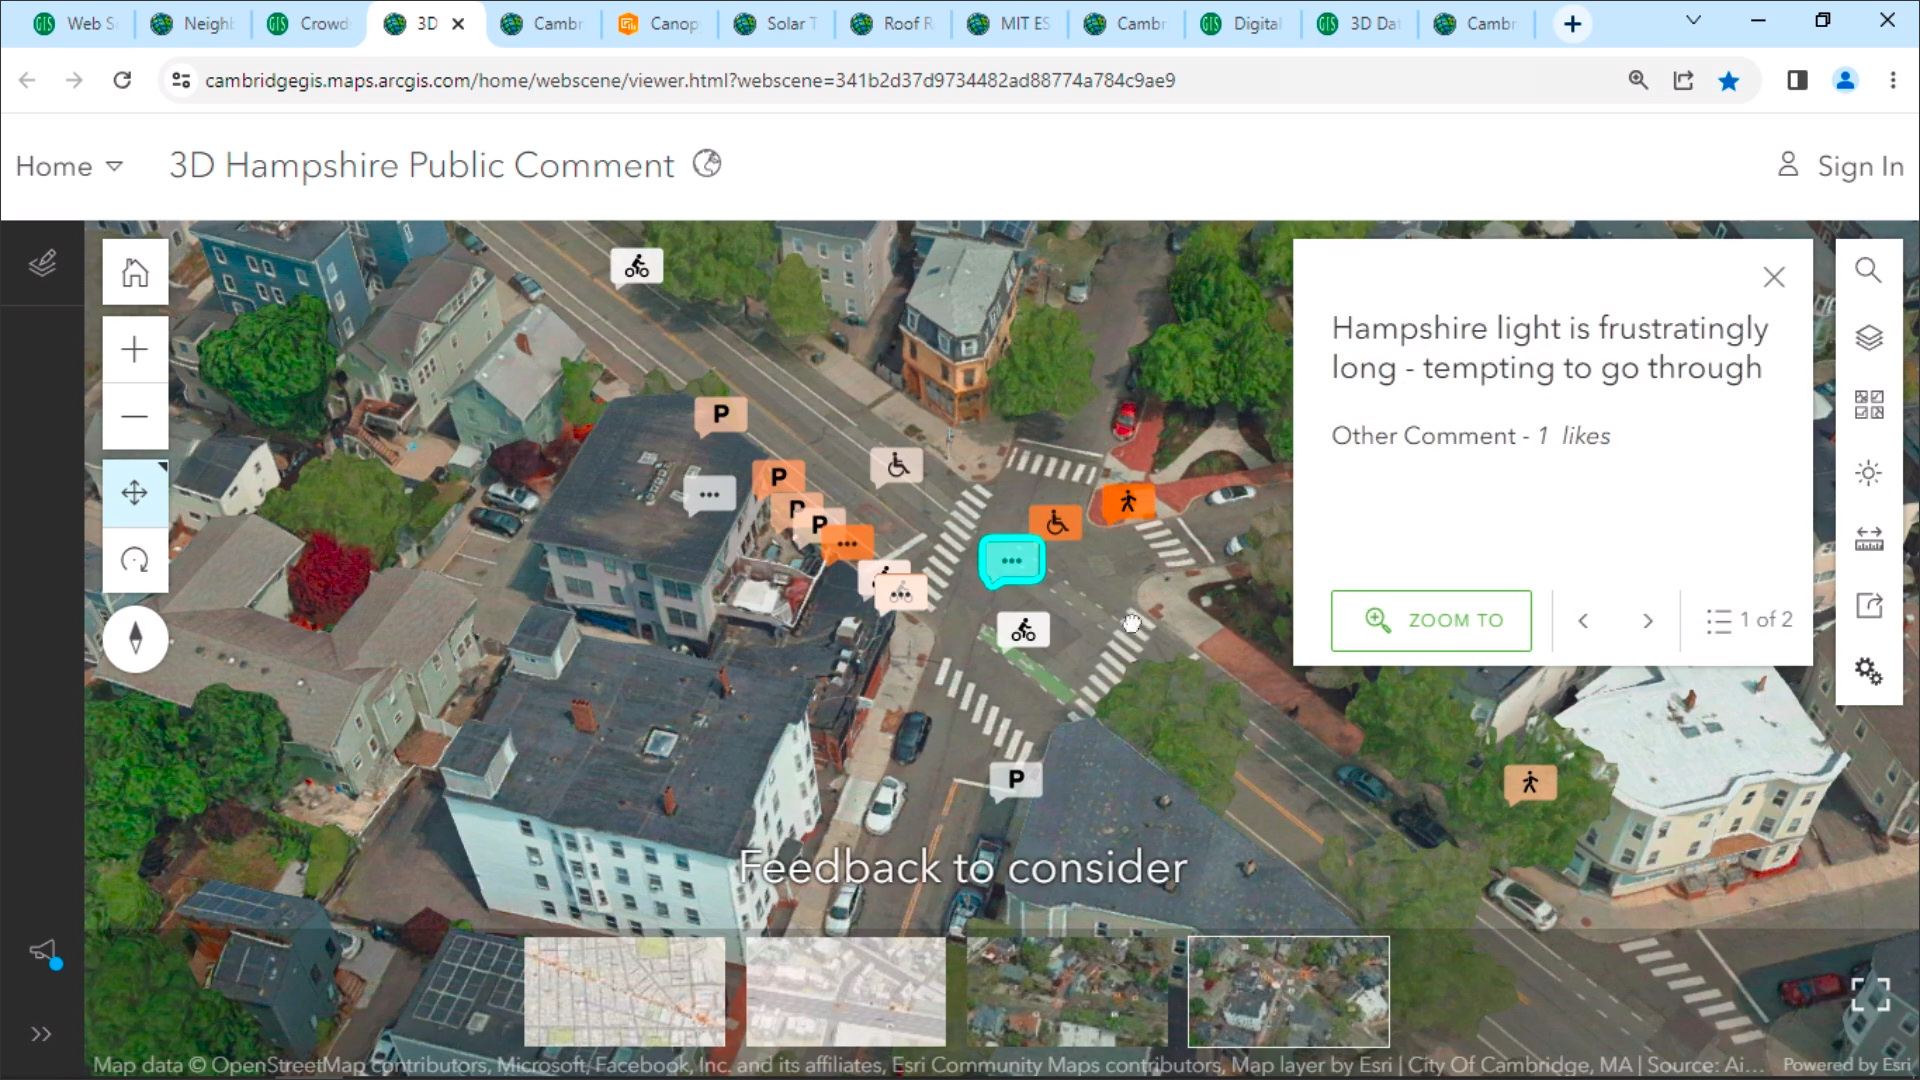
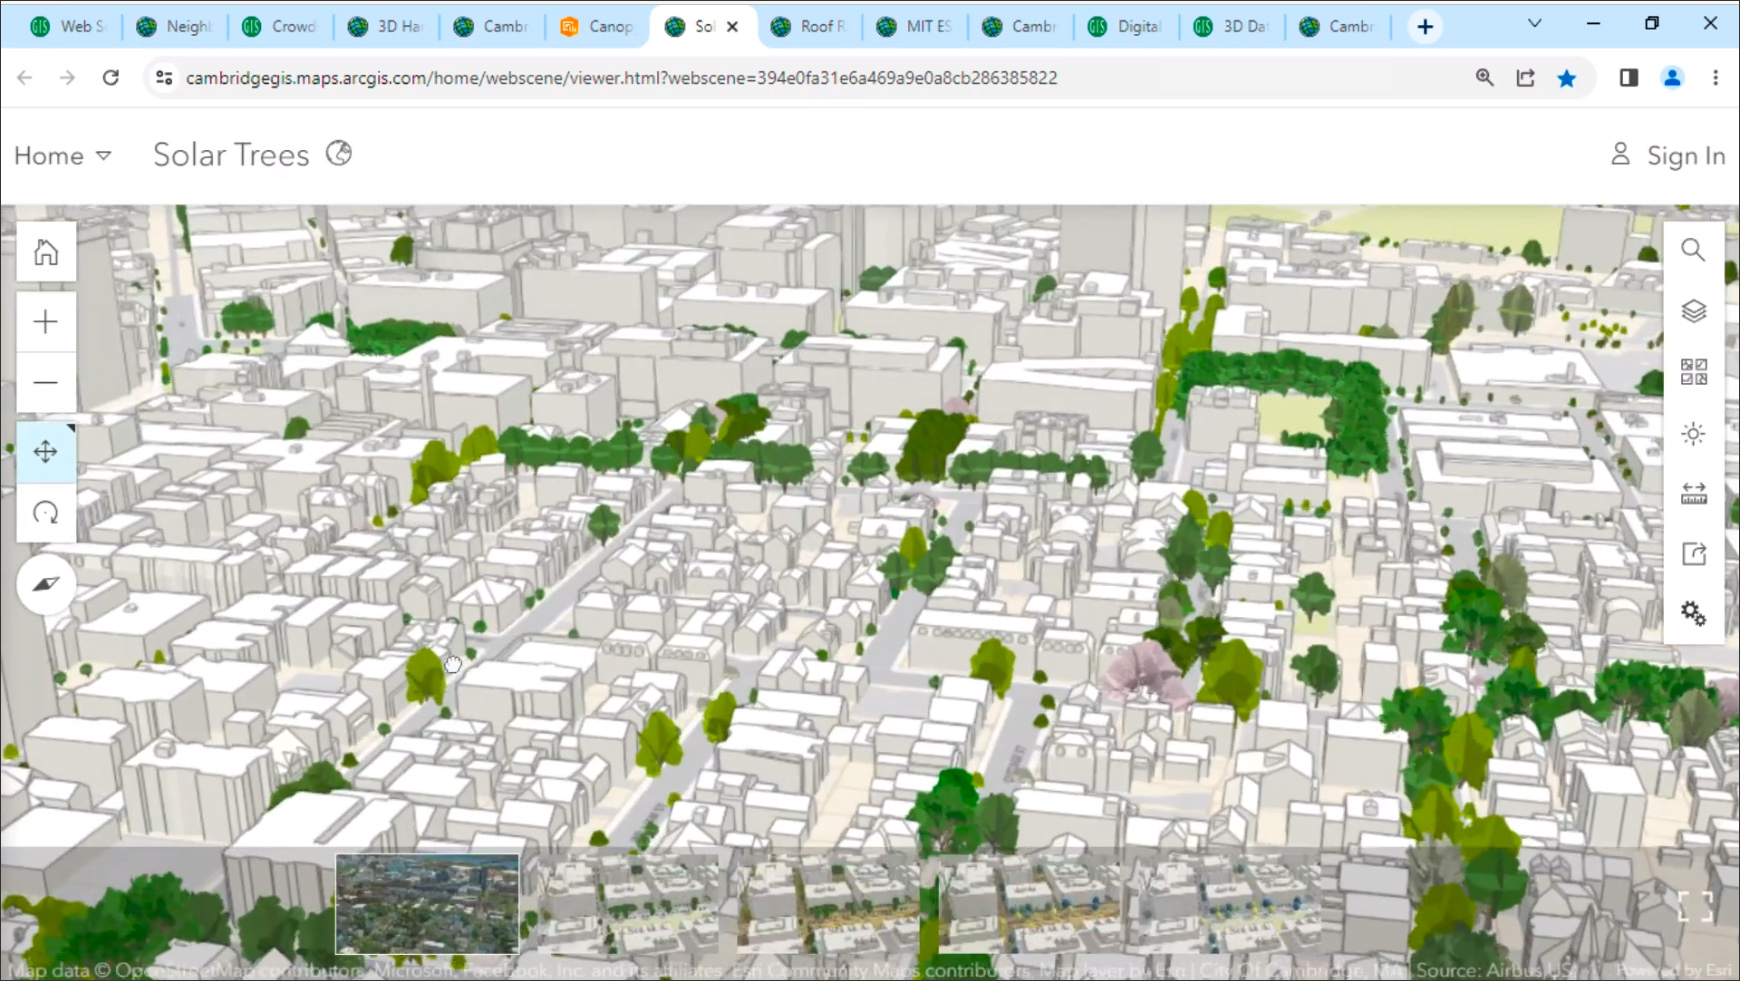
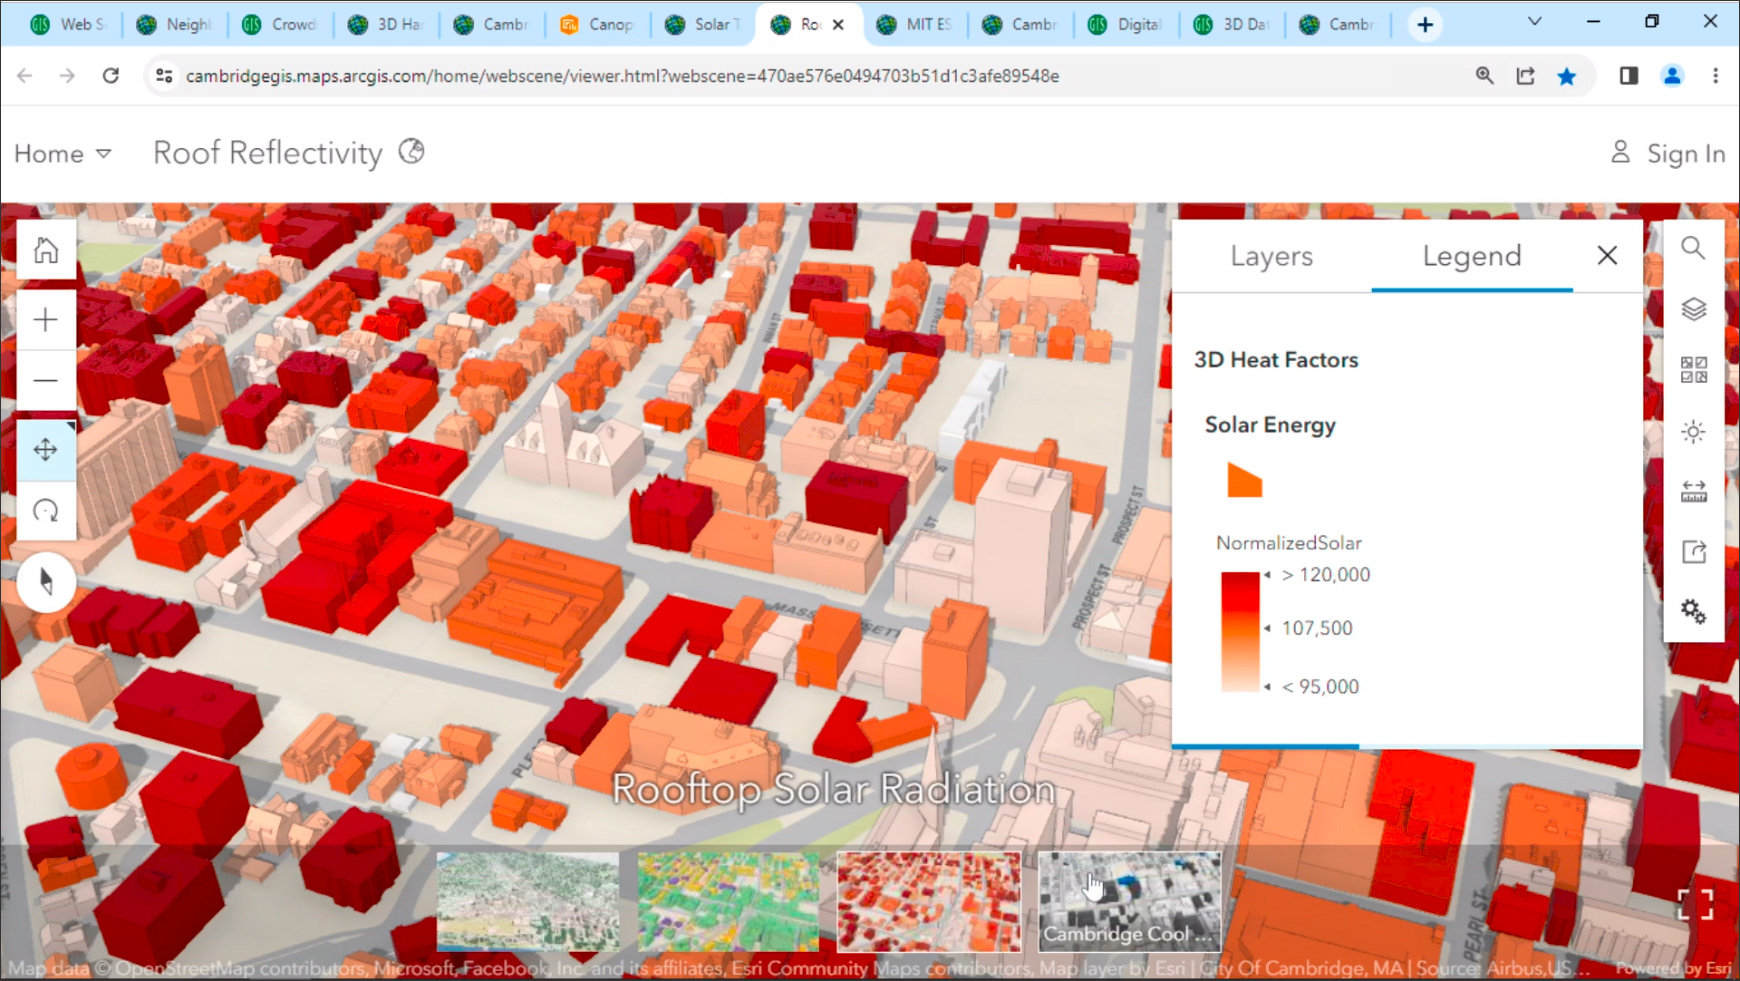
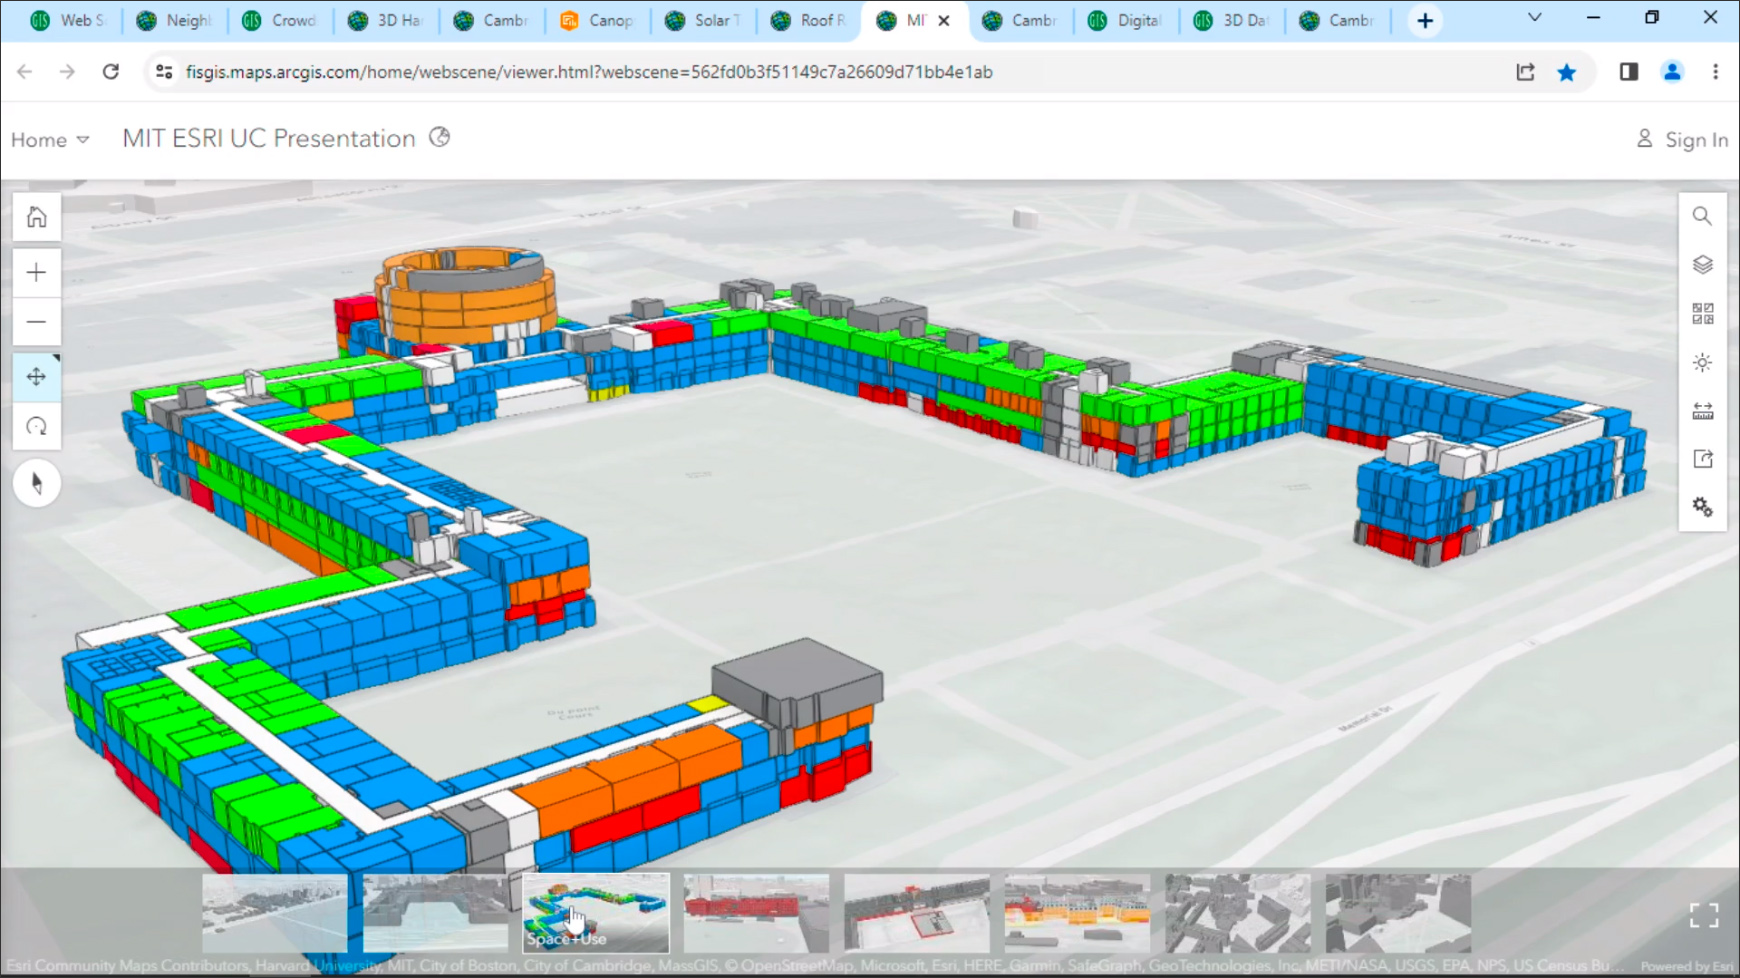
At the Esri conference, city officials shared some of the ways in which the comprehensive 3D city model was being used (Figure 12), such as allowing residents to provide feedback on different aspects though comments that city staff can review, managing the city’s landscaping program, determining which trees to plant and how often they should be watered based on the amount of sunlight in a specific location, and determining which of the roofs of the buildings in the city could be converted to cool roofs to improve the city’s climate resiliency.
There was also a presentation from MIT, which is located in Cambridge and is collaborating with the city on its 3D program, showing how its Facility Information Systems are incorporating the GIS data into their 3D system of record (Figure 13). MIT is a very dense urban campus and comprises over 200 buildings and 41,000 rooms, constituting approximately 14 million sq ft of space. The efficient use of space is very important to the university, and it is using ArcGIS to analyze space usage in their buildings so they can optimize it. Additionally, MIT is using the city’s 3D GIS for the planning and design of its many renovation and capital improvement projects that are in the works. It also showed how it was contributing highly detailed, textured models of its buildings to the city’s 3D model (Figure 14).
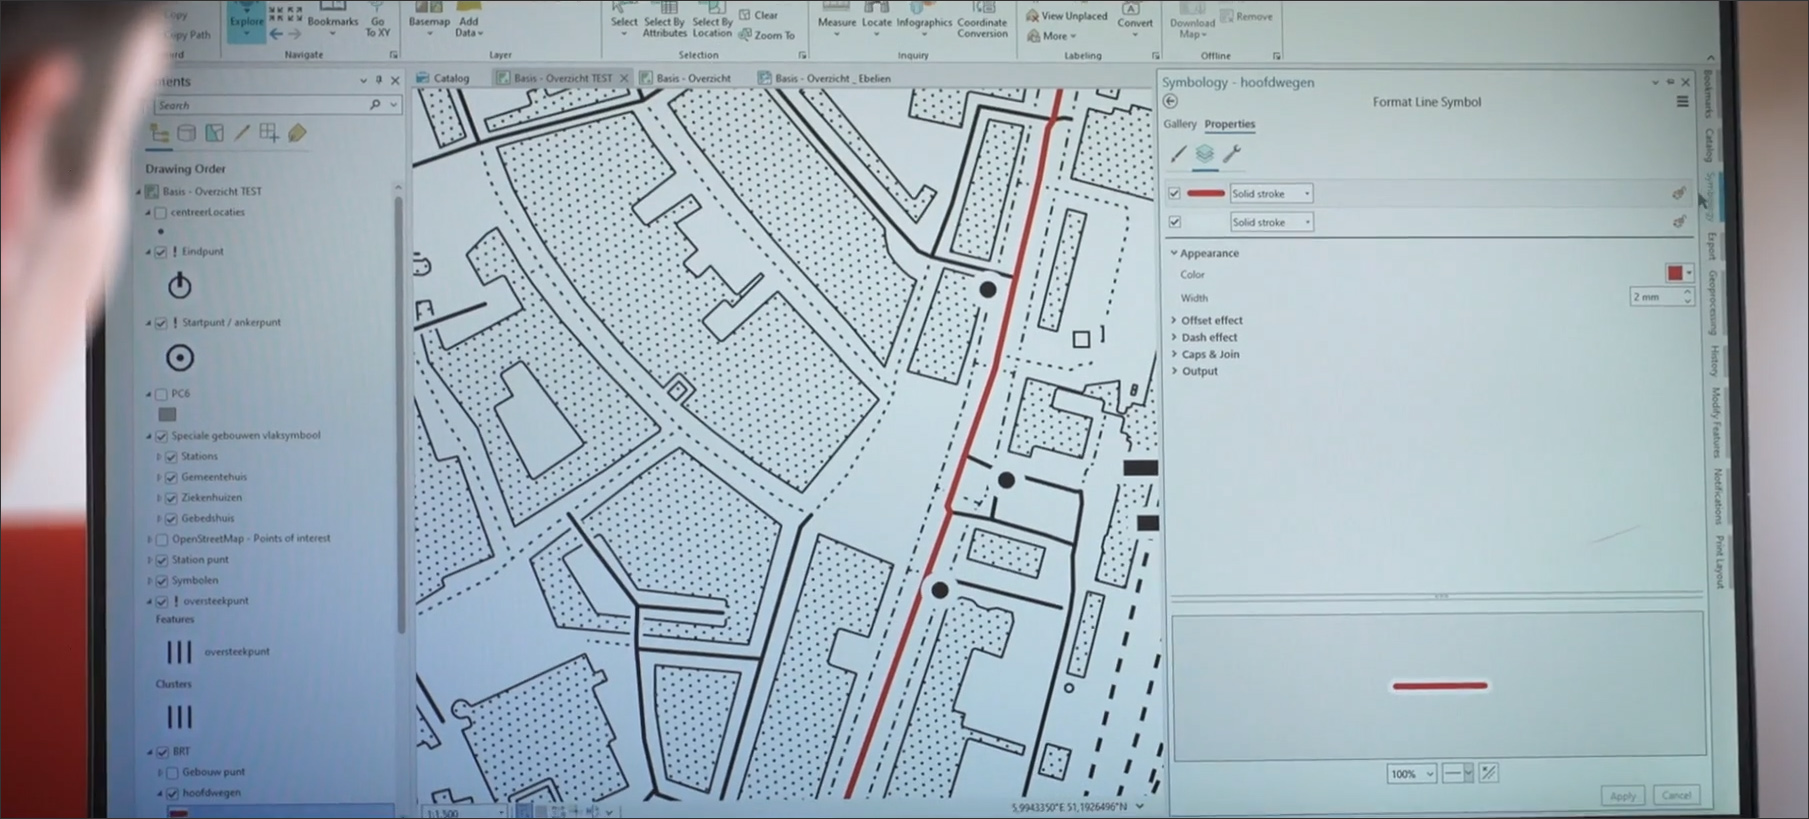
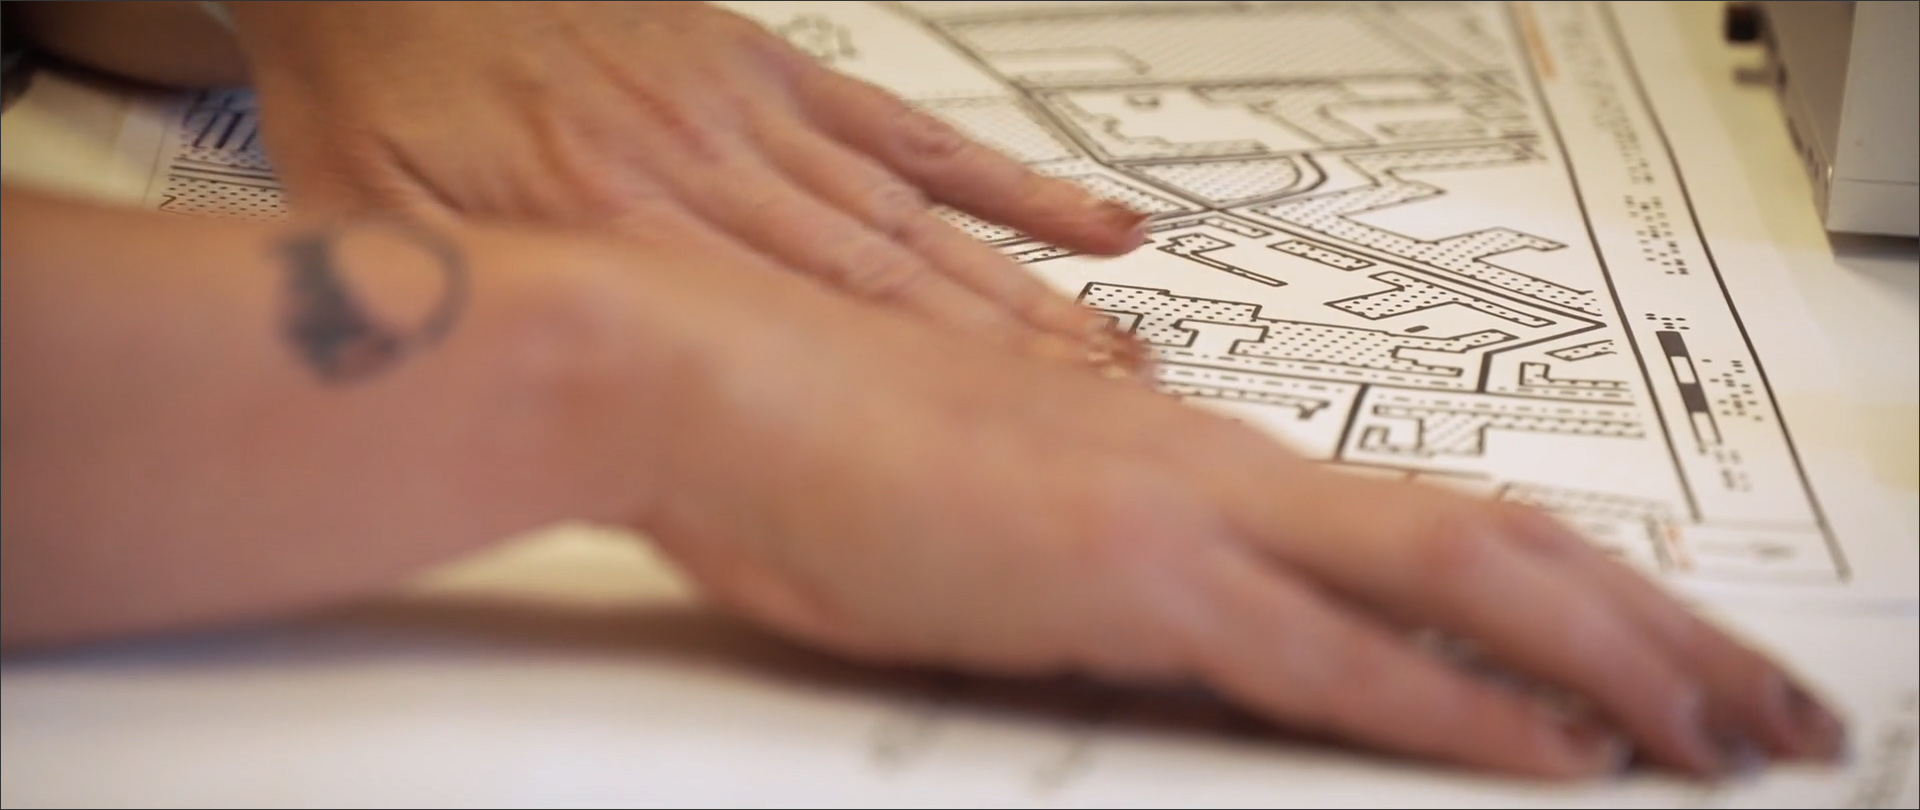
The Netherlands’ Cadastre, Land Registry and Mapping Agency – called Kadaster – has created mapping systems for its visually impaired residents, so they can better understand topographical information for everyday purposes such as walking and crossing roads, navigation in public spaces and larger buildings, finding neighborhood amenities such as parks and coffee shops, understanding news and regional weather forecasts, and overall, be able to explore the world more independently. These maps are digitally designed and printed on special paper with raised ink so that they are Braille-like, allowing blind users to feel the features on the map (Figure 15). Until now, creating these maps has been a manual and labor-intensive process, but with the use of street data and ArcGIS software, the creation of these tactile maps has become a lot easier.
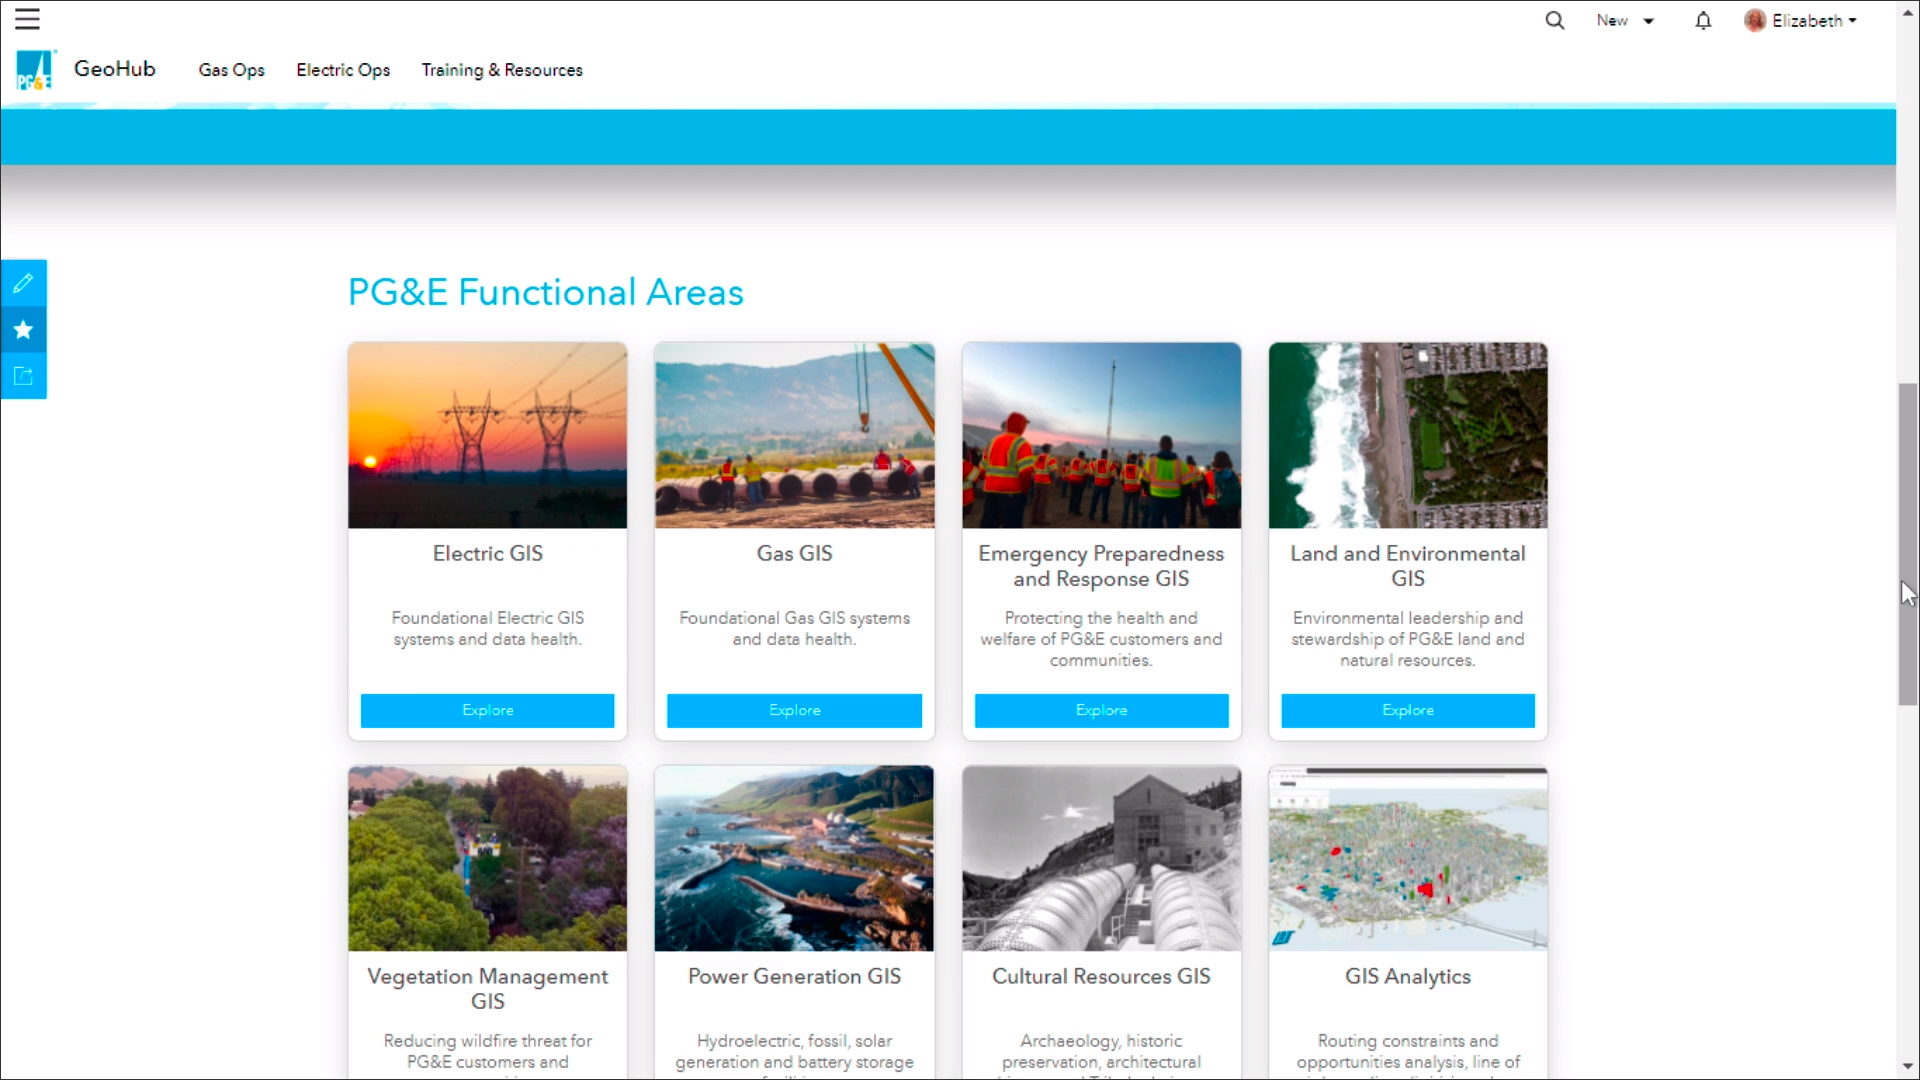
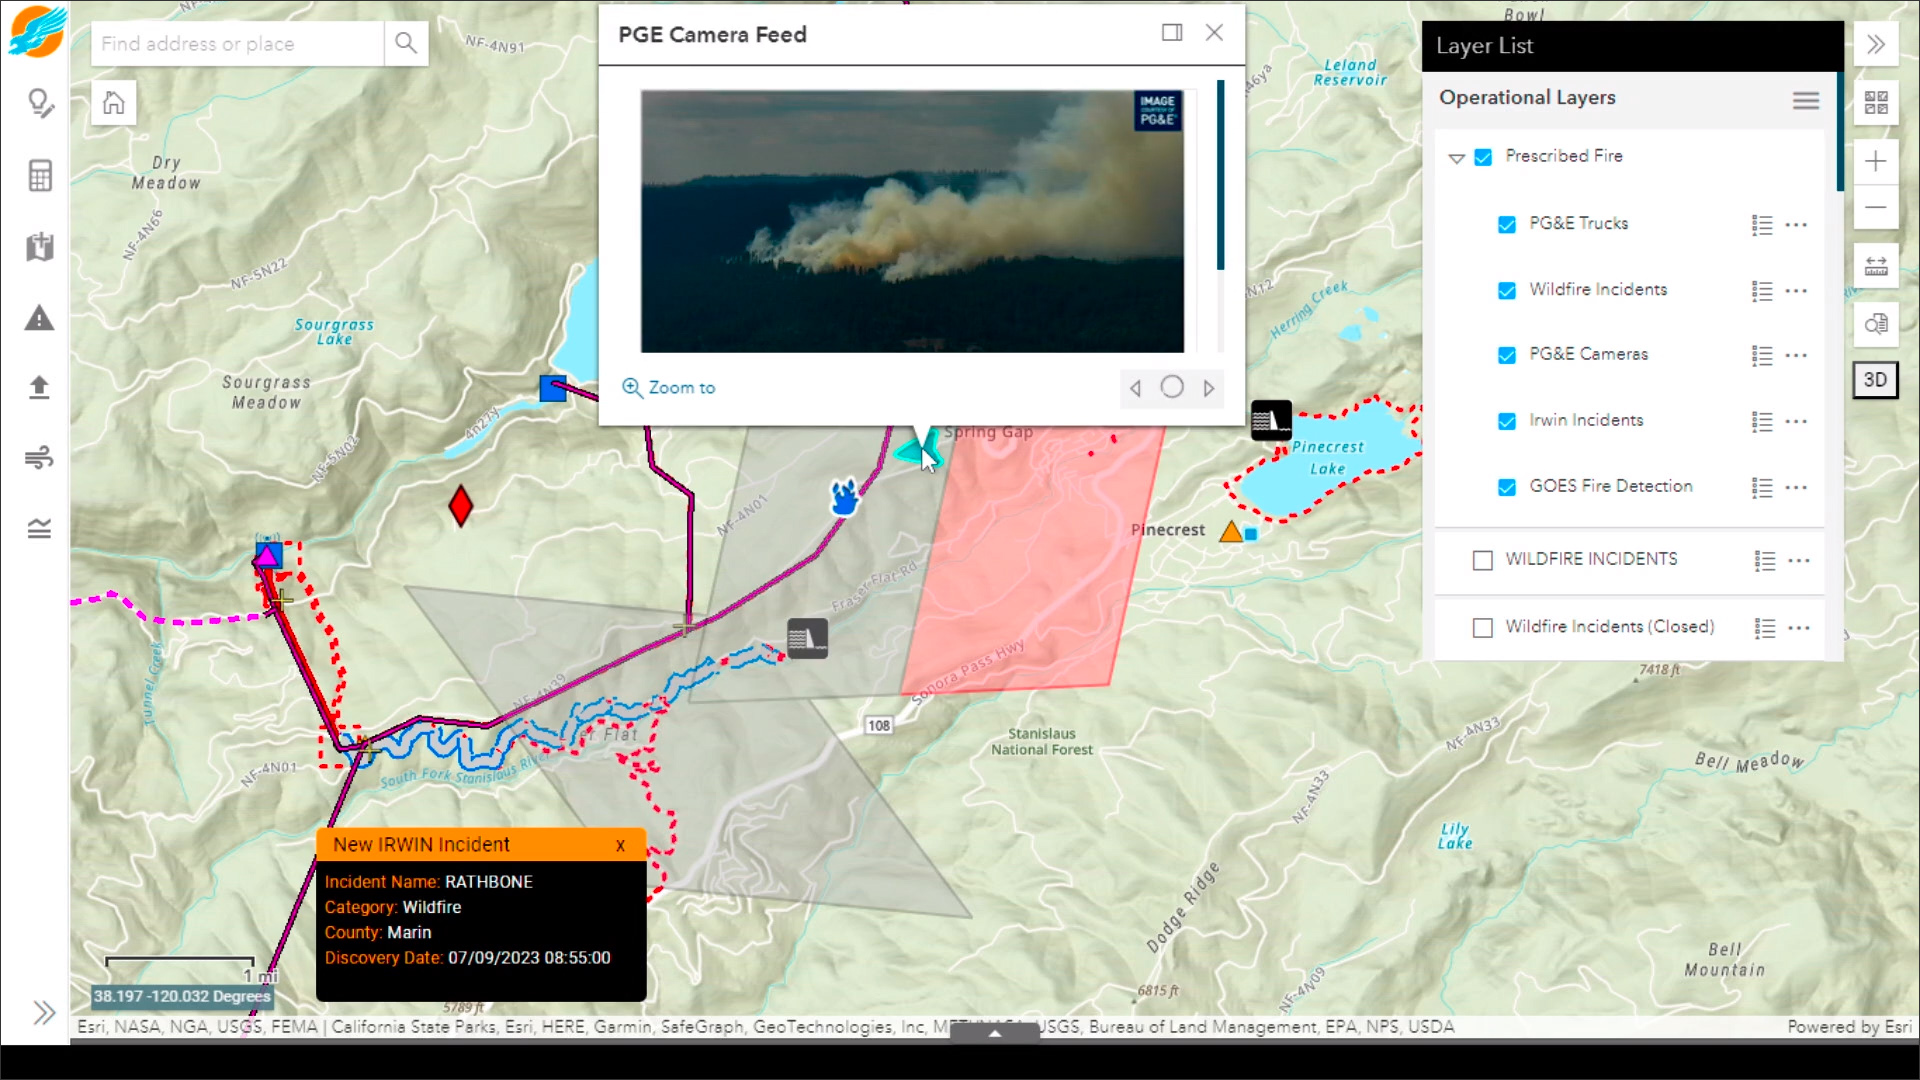
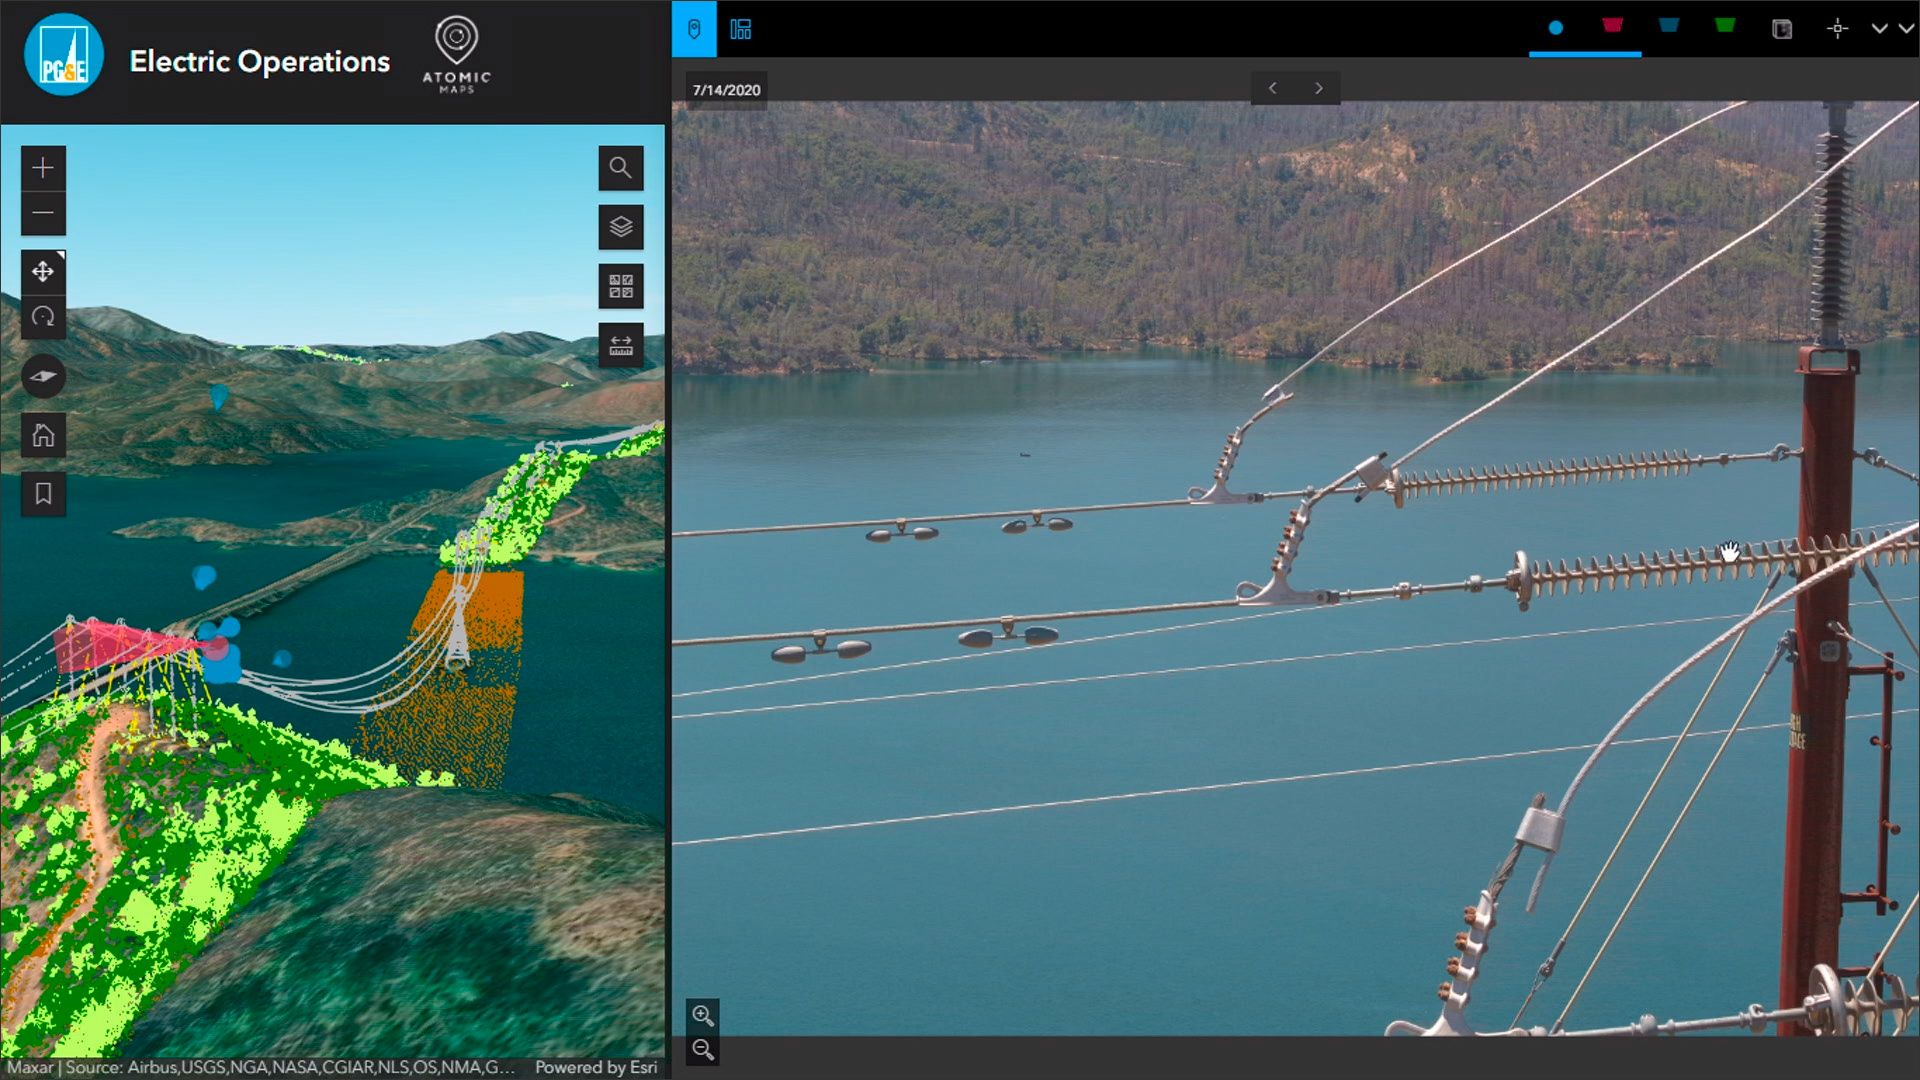
Another large-scale GIS implementation that was showcased was the enterprise-wide adoption of ArcGIS by Pacific Gas and Electric Company (PG&E), one of the largest electric and gas utilities in California which serves over 16 million people across 70,000 square miles. PG&E was established over a hundred years ago, and it has deployed ArcGIS to modernize its systems, workflows, and data processes (Figure 16). All of the 26,000 employees at the company have access to its GIS Hub — on computers in the offices as well as tablets and smartphones in the field — and use it to schedule and execute their tasks more efficiently, effectively, and safely. The location intelligence enabled by ArcGIS powers a 24/7 online Hazard Awareness and Warning Center that includes the real-time locations of employee trucks and nearby weather or environmental hazards. It also allows PG&E to share data about vulnerable populations amid planned outages during wildfire weather conditions with 3,000 partner agencies throughout the state, as well as keep all its customers informed about ongoing outages any time they occur. PG&E is also used ArcGIS Cloud to implement a remote sensing data platform that can tie of its accumulated assets (images, LIDAR, and videos) to maps to enable remote visual inspection, monitoring, and threat detection (Figure 17).
Given how integral mapping is across all fields of human endeavor, it’s hardly surprising to find that a technology like GIS, embodied in an application like ArcGIS, has become so widely used. This article has captured just a few of the many implementation examples that were presented at the conference, showing how it touches every aspect of our lives.
I especially found the implementation example from the Netherlands, which was shown in Figure 15, very inspiring. As one of the visually impaired residents put it, the availability of the tactile maps makes her feel that she is getting the same information as everyone else and “can belong to the world again.” I can’t think of a better testament to the usefulness of technology.
Lachmi Khemlani is founder and editor of AECbytes. She has a Ph.D. in Architecture from UC Berkeley, specializing in intelligent building modeling, and consults and writes on AEC technology.
Have comments or feedback on this article? Visit its AECbytes blog posting to share them with other readers or see what others have to say.
AECbytes content should not be reproduced on any other website, blog, print publication, or newsletter without permission.

This article captures the highlights of two of the sessions from the Smart City Expo World Congress (SCEWC) event held in Barcelona in November: the Smart City Strategy of Madinah in Saudi Arabia, and the journey of Las Condes in Chile to becoming a Smart City.
SimScale’s event highlighted the importance of simulation technology in the design of projects from individual buildings to entire cities. It also included presentations from leading firms such as Thornton Tomasetti, KPF, Zaha Hadid Architects, and Atkins sharing their sustainability initiatives.
This article provides an overview of Nearmap, which provides frequently-updated aerial imagery of most of the populated areas in North America, Australia, and New Zealand for use in building and infrastructure design. It also includes AI-enabled automatic feature detection capabilities to make sense of the imagery.
This article explores the solutions for “city information modeling” from BIM stalwarts such as Autodesk and Bentley to CIM-specific companies such as virtualcitySYSTEMS, Cityzenith, SmarterBetterCities, CyberCity 3D, and Agency9. Also, how is CIM different from the concept of “Smart Cities?”.