


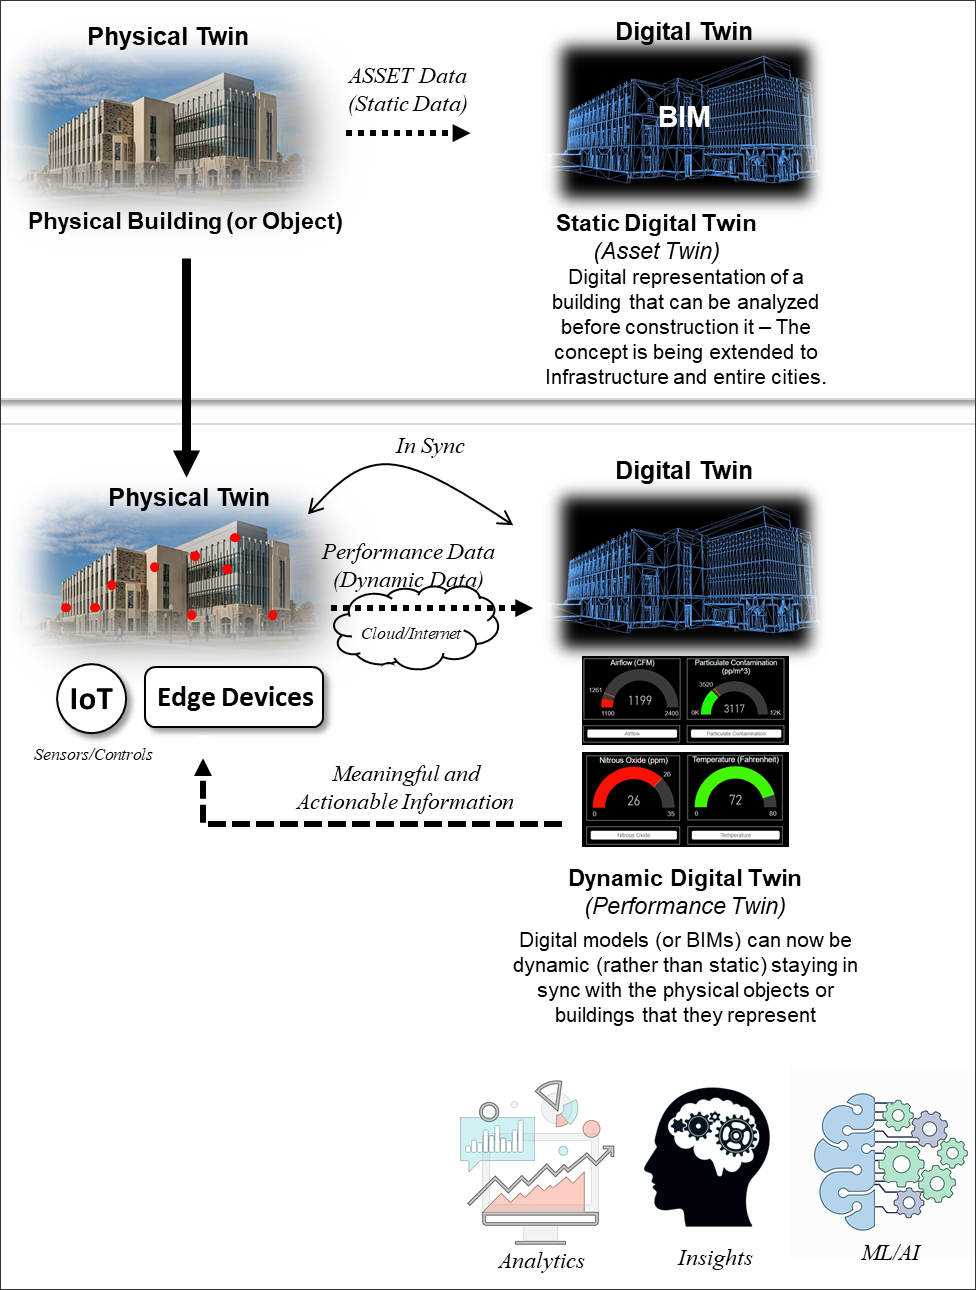
Building Information Modeling (BIM) provides the ability to create a static digital representation of an object or a building that can be analyzed before and during its construction. The digital representation offered by the BIM includes a graphical representation of the physical entity along with its static data. A Digital Twin extends the limits of the BIM digital representation of the physical asset to a more complex and dynamic representation. In a Digital Twin, devices (e.g., sensors, controls, edge devices, etc.) connected to the physical asset collect and transfer various types of data in near real-time to the virtual representation. This added valuable dynamic data source provides the ability to report on various aspects of the physical twin including its location, functional and operational statuses, and allows users to virtually inspect, monitor, analyze, and adjust its operability from its virtual representation.
There are three major differences between Building Information Models and Digital Twins:
Multiple definitions of a Digital Twin have been provided by researchers and practitioners, but each definition focuses on three components: the physical space, the virtual space, and connected data. Based on the level of integration and data flow automation between these three components, a Digital Twin can be classified as [Reference: Kritzinger, Karner, Traar, Henjes, & Sihn, 2018]:
A Digital Twin maintains a constant link with its physical counterpart, hence providing the ability to predict and enhance the future behavior of the physical asset. Life cycle data collected via the Digital Twin can be used to improve future design choices. A Digital Twin also allows performing simulation of the environment in which the physical asset is located or serving. This simulation can help in running multiple what-if scenarios to optimize the performance of the physical twin based on various criteria such as outside weather conditions, building occupancy, building design, and so on.
The current adoption and implementation of the Digital Twin in the A/E/C/FM industry are still in their infancy. The process of setting up a Digital Twin remains a complex and technically demanding step. Implementing a Digital Twin also requires a massive amount of data to be collected from multiple endpoints creating issues of security and scalability. Current high costs associated with digital twin implementation are another reason behind its slow adoption. Figure 1 shows the transition of BIM to a Digital Twin.
With the increase in complexity and data management needs of new building projects, traditional methods such as BIM are not capable of keeping up with the real-time updates of building systems. This becomes specifically true for healthcare facilities with different areas like medical, public, clinical, and surgery having their own specific needs and industry-standard requirements. Along with spaces, healthcare facilities also house specialized building systems like medical gas systems, pneumatic logistic systems, and medical sewage systems. Though BIM has been utilized for facility management, energy management, safety management, and coordination with the Computerized Maintenance Manage Systems (CMMS), the lack of interaction of BIM with real-time or near real-time data, and the lack of tools to analyze the data have limited the usability of BIM in complex projects including healthcare facilities.
To overcome the limitation of BIM, researchers at the Virtual Facilities Research Lab (VRFL) at Virginia Tech have explored use cases of Digital Twins for the operating and maintenance of healthcare facilities. Based on several interviews and discussions with BIM and facility managers as well as clinical staff at a health care facility in Denver, Colorado, specific space management and facility maintenance use-case areas were identified that can benefit from the use of a Digital Twin.
Space management focuses on performing data entry and updates for facility spaces. This includes updating architectural drawings and assigning occupants, categories and types, and departments to the spaces. Space Management also focuses on managing clinical furnishings and planning occupant and department moves. Seven areas of space management that can benefit from the application of Digital Twins have been identified:
Facility maintenance focuses on performing preventive and corrective maintenance work for building equipment, assets, and systems. This includes scheduled testing, cleaning, and repair. The following describes four use-cases for facility maintenance.
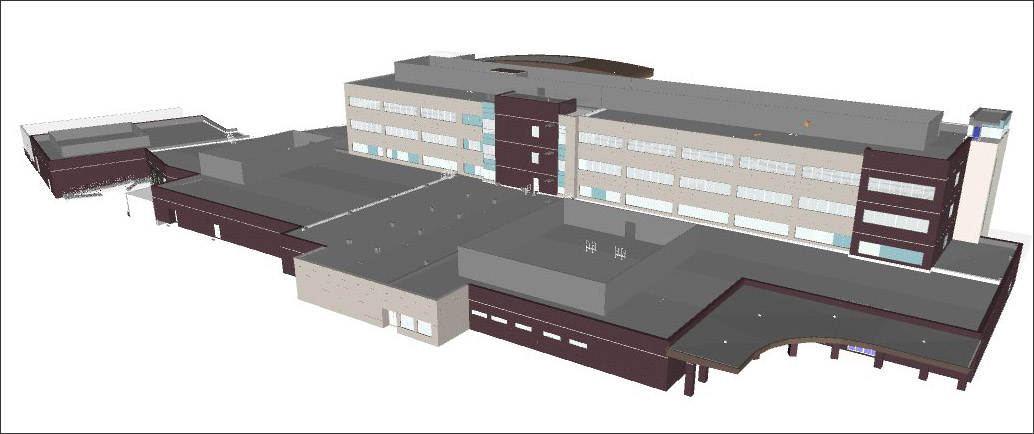
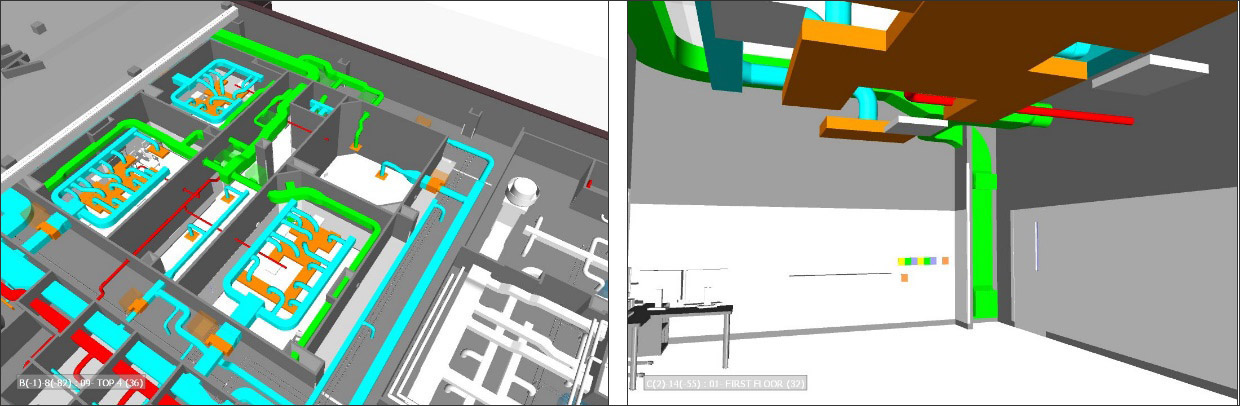
The case study involves the implementation of a Digital Twin to monitor air quality conditions for an Operating Room (OR) suite located in a healthcare facility in Colorado. The facility is a 325,000 sqft 4-story building with 50-beds that can be expanded to 150 beds. The healthcare facility provides services such as intensive care, emergency, surgery, radiology, advanced cardiology, birth center, and an in-house pharmacy. The Navisworks model of the OR is integrated with sensor data to provide near real-time information to monitor five main air quality parameters: particulate contamination, airflow, N2O concentration, temperature, and humidity. Figure 2 shows the Navisworks model of the overall healthcare facility building (top image) and the OR suite (lower images).
In the United States, standard temperatures for operating rooms are kept to between 70°F to 75°F with humidity between 50% to 60% [Reference: Ellis, 1963]. Additionally, the INAIL and ISO 14644-1 [Reference: Romano, Milani, Ricci, & Joppolo, 2020] put the threshold limit for airborne particles in an ISO Class 5 operating room at 3520 particle/meter cube for particles with a diameter greater than 0.5 micrometers. To reduce the rate of infection in an OR, 20 Air Changes per Hour are recommended [Reference: Khankari, 2018]. Additionally, the N2O concentration should be below 25 ppm as a time-weighted average during the period of anesthetic administration to prevent a decrease in mental performance, audiovisual ability, and manual dexterity of the operators [Reference: National Institute for Occupational Safety Health, 1994].
The Digital Twin developed for this case study will monitor these key parameters. Temperature and humidity will be measured every 15 minutes daily. Other parameters will be measured every 15 minutes only when the OR is occupied.
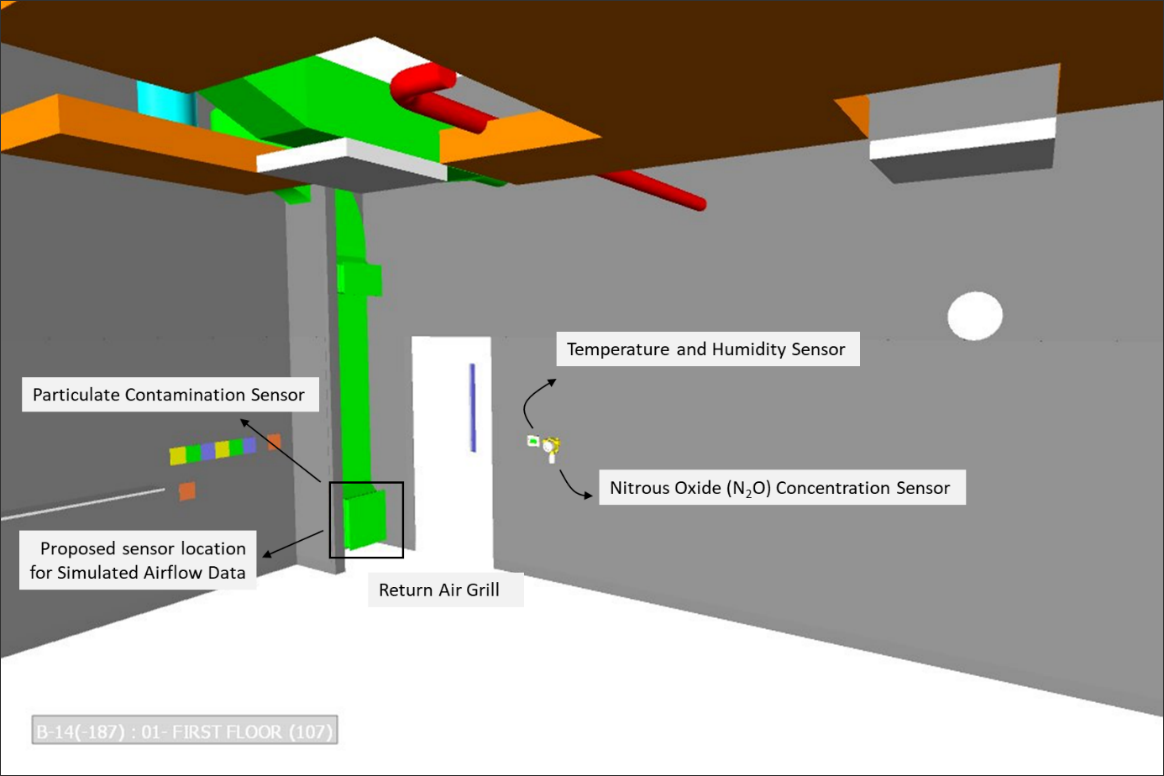
For this case study, temperature, humidity, N2O, and particulate contamination data are collected using sensors connected to a Raspberry Pi 4 processor capable of collecting data from the sensors and transmitting the data to Azure IoT Hub. An airflow sensor capable of collecting airflow data for return air was unavailable, therefore the airflow data used in this study is simulated using sample data provided by the facility manager. To represent the sensors in the OR Navisworks model, graphical elements representing the sensors were appended to the model. These sensors are not installed in the room. Rather, they were tested in a lab setting. In the OR Navisworks model temperature, humidity, and N2O sensors are proposed to be located on the wall closer to the entry door of the OR. The particulate contamination and airflow sensors are proposed to be located within the return duct. Figure 3 shows the proposed location of sensors in the OR model.
For this study, the Raspberry Pi 4 processor is used to receive information from the sensors, convert the data into a human-readable numerical format, and transmit the data to Azure IoT Hub. Using Azure Stream Analytics Services, data is stored in the Azure SQL database. We utilized off-the-shelf commercially available sensors. Table 1 shows the list of sensors used in this study.
| Data Type | Sensor |
|---|---|
| Temperature and Humidity | DHT11 |
| N2O concentration | MQ-135 |
| Particulate contamination | PMSA003I |
These sensors have a specific working principle to collect the required information, along with ideal working conditions and data range. To select the most appropriate sensor it is important to understand these features of the sensors.
The following sections provide more details about the Raspberry Pi 4 processor and the sensors used.
The Raspberry Pi 4 is the latest product from a range of miniature computers with a performance comparable to an entry-level x86 PC system (Raspberry Pi Trading Ltd., 2021). Some of its features include a high-performance 64-bit quad-core processor, dual-display output via two Micro HDMI ports with up to 4K resolution, hardware video decoding at up to 4Kp60, dual-band 2.4/5.0 GHz wireless LAN, Bluetooth 5.0, Gigabit Ethernet, USB 3.0 and PoE capability. The Raspberry Pi 4 comes in three onboard RAM options: 2GB, 4GB, and 8GB. Because it is pre-equipped with dual-band wireless LAN and ethernet capabilities, the Raspberry Pi 4 computer can connect to the internet with no additional hardware requirements making it more advantageous compared to an Arduino computer that was also considered for this study. The Debian operating system is the officially supported system for the Raspberry Pi 4 hardware. Other operating systems are available commercially as well. Due to the higher power requirements, the Raspberry Pi 4 requires a 3.0A USB-C power supply.
Figure 4 shows an image of the Raspberry Pi 4 used for this study.
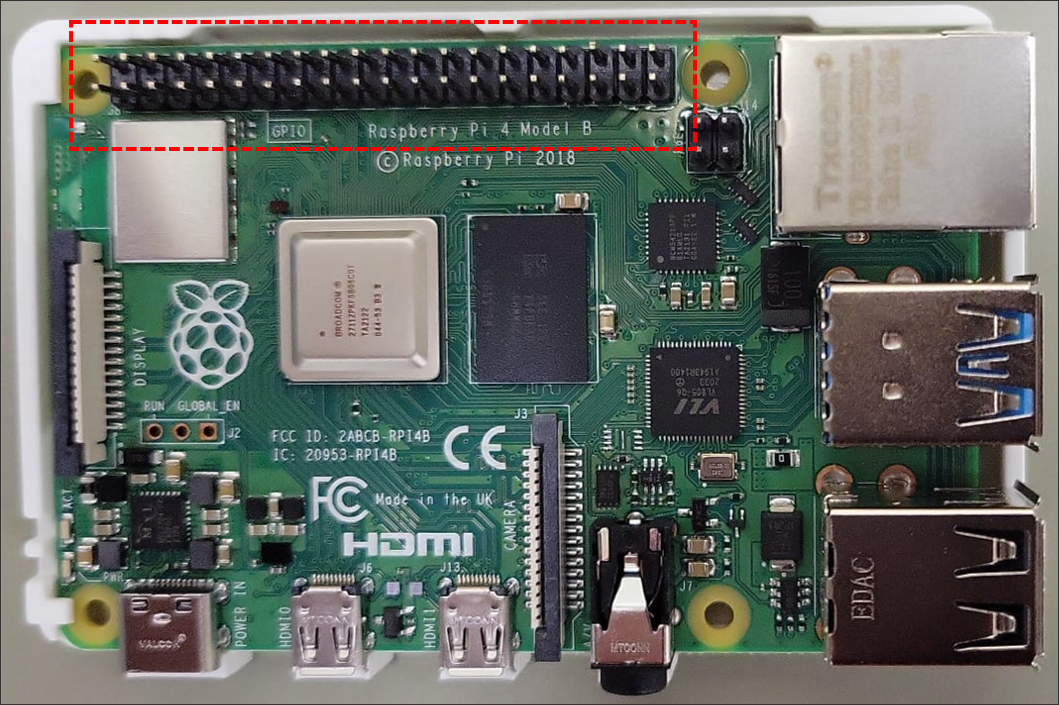
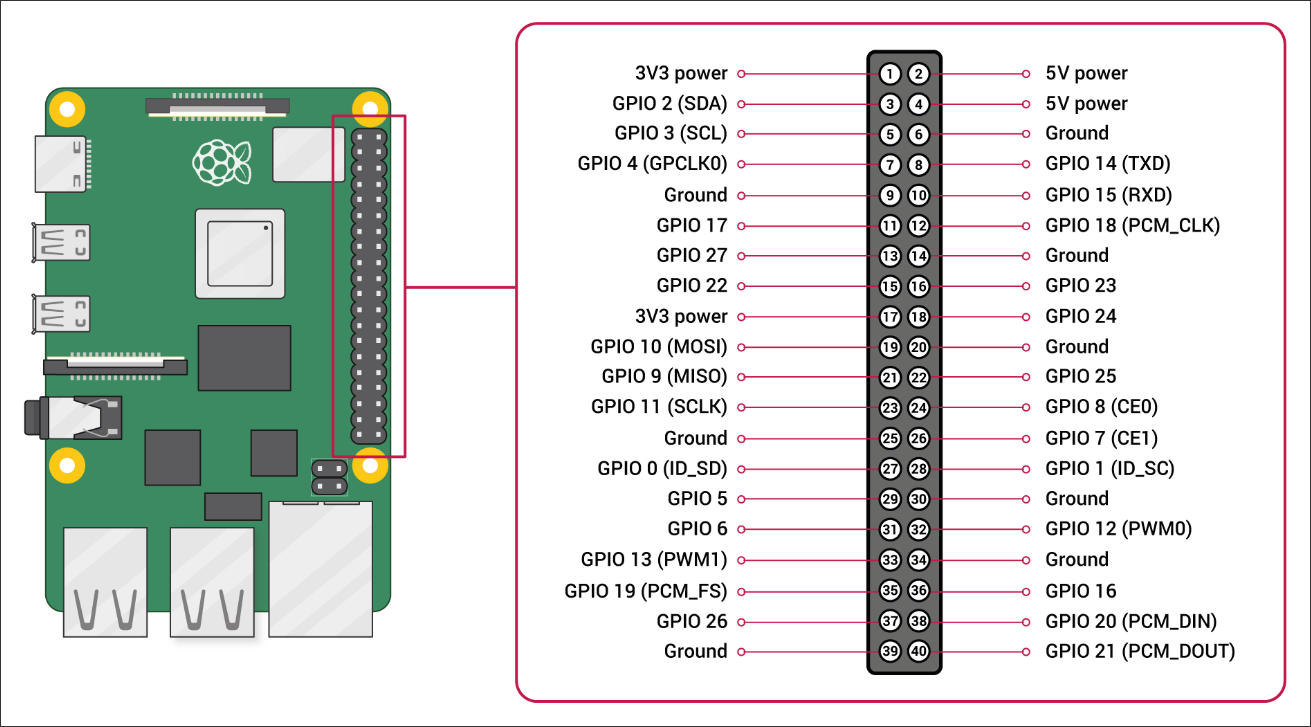
Another important feature of Raspberry Pi 4 is a row of general-purpose input/output (GPIO) pins located on the edge of the board shown in figure 4 (highlighted in red). The Raspberry Pi model 4 used for this case study has 40 GPIO pins. Each pin can work in either an input or output There are two 5V pins, two 3.3V pins, eight ground pins, and the rest of the pins are general purpose 3.3V pins with output set to 3.3V and input set to 3.3V tolerant. The pins designated as output or input can be set to high (3.3V) or low (0V) [Reference: Raspberry Pi Trading Ltd., 2022]. Figure 5 shows the specifications of the GPIO pins in a Raspberry Pi 4. Users need to specify which pins are being used for input and which are being used for output when connecting with sensors using Python code. This can be done by specifying the pin number in the code.
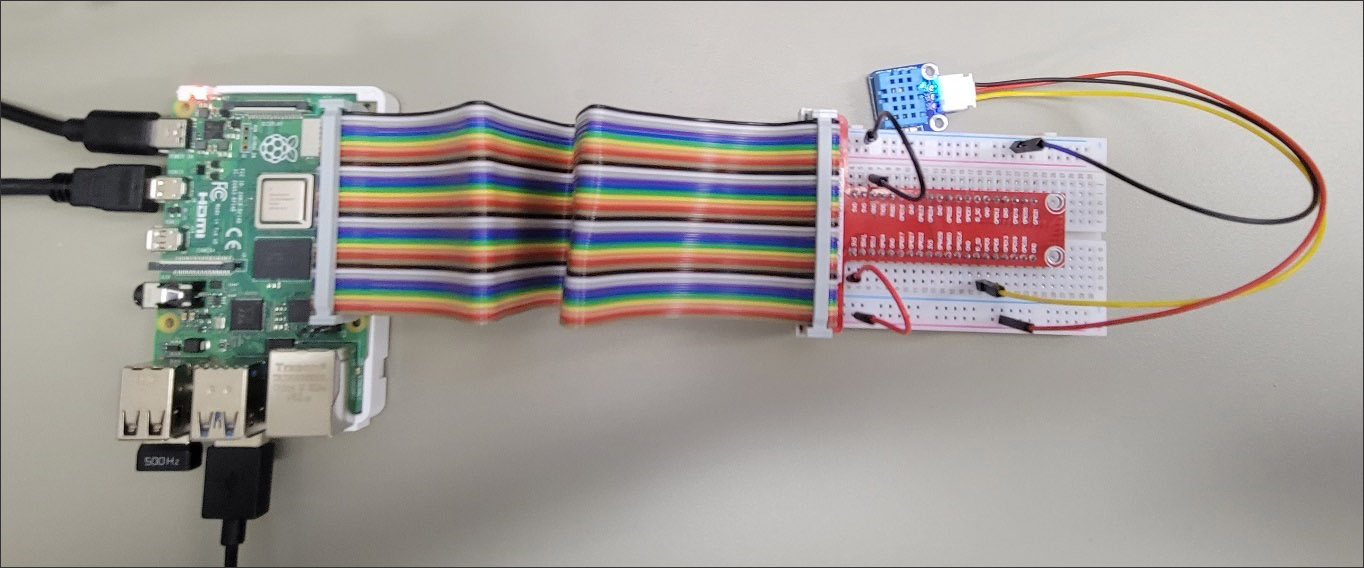
To avoid damage to the pins by frequent plugging in or out of devices/sensors, the pins can be easily connected to a breadboard using a GPIO Extension board. Figure 6 shows the setup used to connect the Raspberry Pi 4 to a humiture (temperature and humidity) sensor using an extension board.
The details of the three types of sensors used for measuring air quality in the OR suite are provided below.
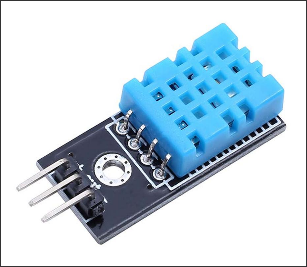
The DHT11 Temperature and Humidity sensor, shown in figure 7, is capable of measuring temperature in the range of 32°F to 122°F and relative humidity in the range of 20% to 90%. The power supply for DHT11 is 3-5.5V DC [Reference: Mouser Electronics]. The sensor can measure new data once every 2 seconds resulting in a 2 seconds latency between the data collected and data transmitted [Reference: Adafruit].
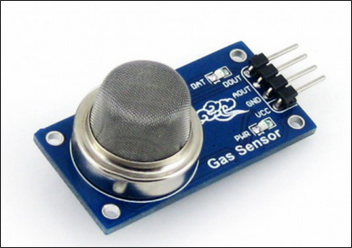
The MQ-135 gas sensor, shown in Figure 8, is used for air quality control operations in buildings and has the capabilities of detecting NH3, NOx (including N2O), alcohol, Benzene, smoke, and CO2. The sensor uses SnO2 as the sensitive material to measure the concentration of gases in the air [Reference: Zhengzhou Winsen Electronics Technology Co. Ltd, 2015]. The sensitive material has low conductivity in clean air, with conductivity rising as the concentration of gases rises. Users can measure the change in conductivity to the corresponding change in concentration of gases. The sensor has a detection range of 10 to 1000 ppm. The working condition required for the sensor is a relative humidity of 65%±5% and a temperature of 68°F±2°F.
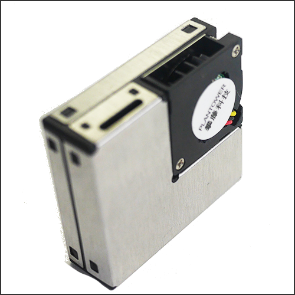
The PMSA003I is a universal practical concentration sensor that works on the principle of laser scattering to detect suspended particles in the air. The sensor records the light scattered by the particles to output the count of the particles of different sizes [Reference: Adafruit, 2018]. The sensor can provide a count for particles with diameters of 1.0, 2.5, and 10 micrometers. It outputs the number of particles of a specific diameter per 0.1L of air or particle mass concentration in microgram/meter-cube. The operating temperature for the sensor is 14°F to 140°F [Reference: Smart Prototyping].
The Raspberry Pi 4 must first be configured to be able to collect and process sensor readings. Due to the recent increase in interest in Digital Twins and the development of services like Azure IoT Hub, open-source codes to assist in the collection, translation, and transmission of sensor data are becoming more readily available in multiple programming languages. For this study, the authors used Python due to their familiarity with the language and the abundance of documentation for libraries and packages online.
Once the Raspberry Pi is connected to the sensors using the GPIO pin system, users can use any Python IDE that came pre-installed with the Debian OS to run Python code allowing the Raspberry Pi to collect, transform, and transmit data from the connected sensor. Figure 10 shows the steps to run the code.
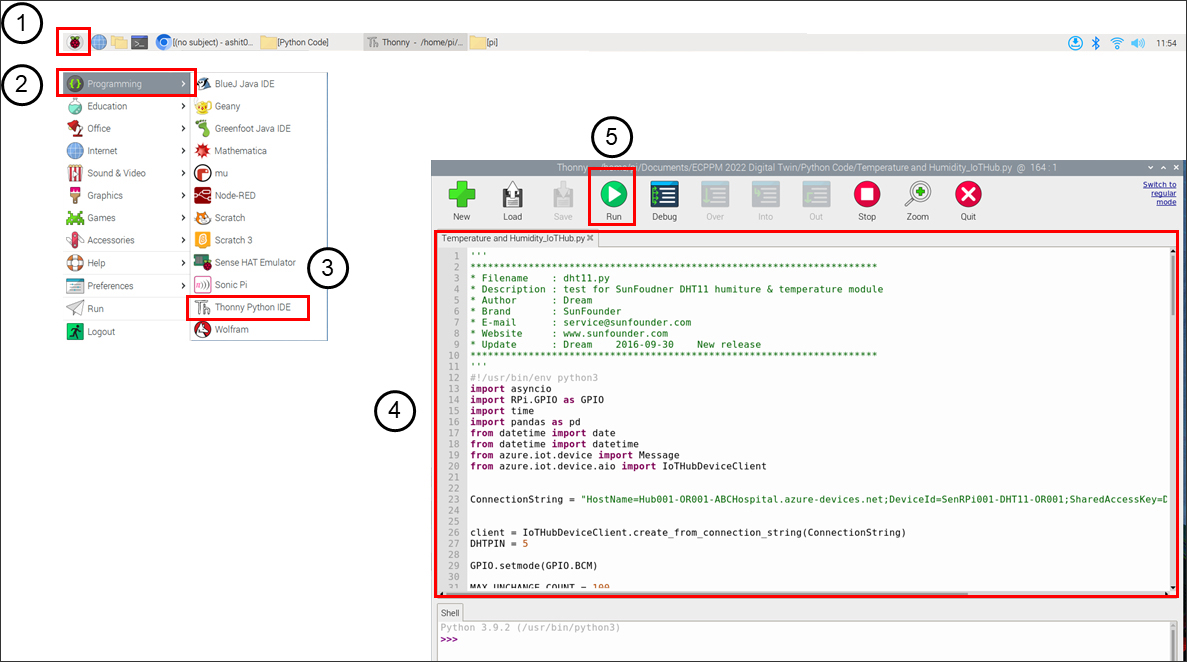
Once logged into the Raspberry Pi 4 system, users need to navigate to the “Programming” option (2) in the “main menu” (1) of the Raspberry PI 4 OS. From the “Programming” option, select and open any pre-installed Python IDE (3). Type in the code to connect, collect, transform, and store the data from the sensor (4) and then select “Run” (5) to generate the desired output.
Using the DHT11 sensor as an example, the following section provides a detailed explanation of how the SunFounder (STEAM education company) open-source Python code was used and modified to connect to the DHT11 and collect temperature and humidity data. The SunFounder open-source Python code can either be copied from their Github webpage [Reference: SunFounder, 2021]. The code implementation is divided into two sections:
This section of the code is dependent on the type of sensor used, how it collects information from its environment and how it translates the information into a human-readable format. For the DHT11 sensor, the temperature and humidity data are transmitted as a 40-bit humiture data: 8-bit humidity integer + 8-bit humidity decimal + 8-bit temperature integer + 8-bit temperature decimal + 8-bit checksum. As computers operate in 0s and 1s, an 8-bit data can have a value between 00000000 to 11111111 leading to the possibility of expressing 256 unique characters. In an 8-bit data, 0s and 1s can fill eight spaces to denote the information generated by the sensors. For example, the numerical value of “26” will be represented as “00011010” in 8-bit format.
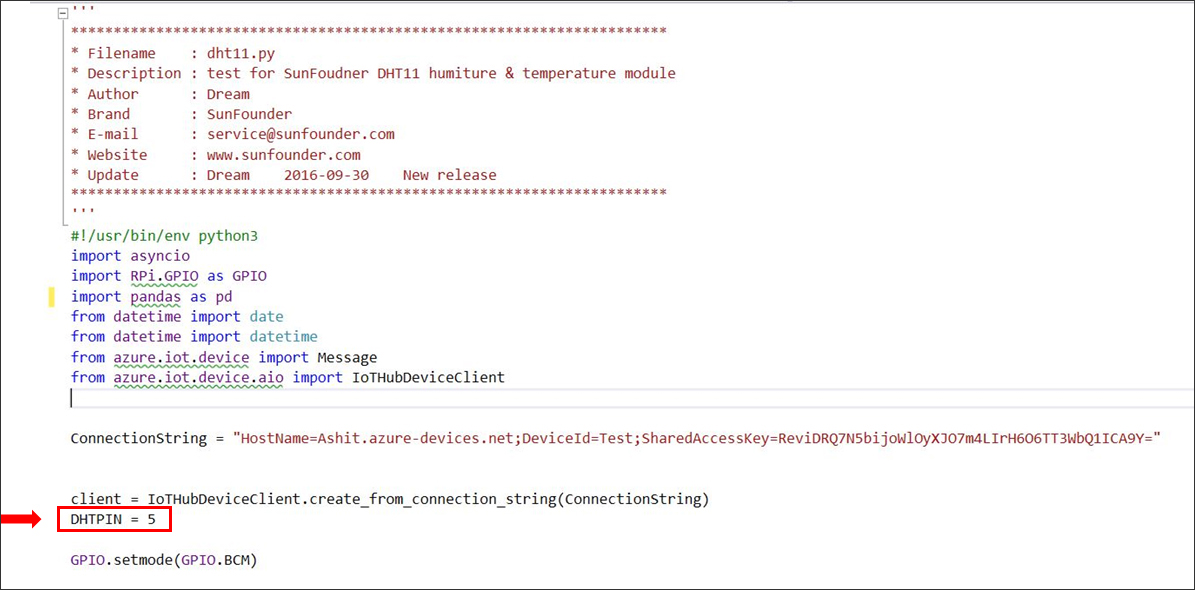
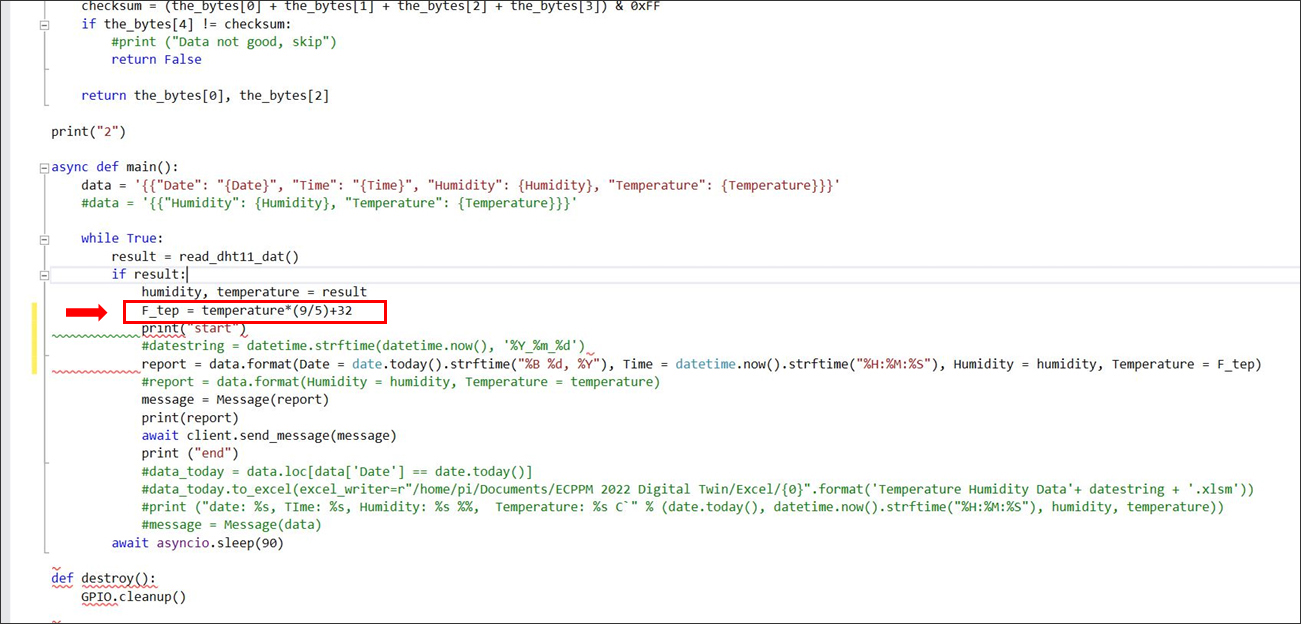
To convert this data into a human-readable format, the SunFounder open-source Python code is downloaded and modified to capture humidity and temperature data from the DHT11 sensor and convert the data to numerical values. Two modifications in the code are made. First, the GPIO pin in the Raspberry Pi 4 to which the DHT11 sensor is connected is specified in the first line of the code as shown in the top image of Figure 11. Second, the code that translates temperature into degrees Celsius (default) is modified to display temperature in degrees Fahrenheit as shown in the lower image of Figure 11.
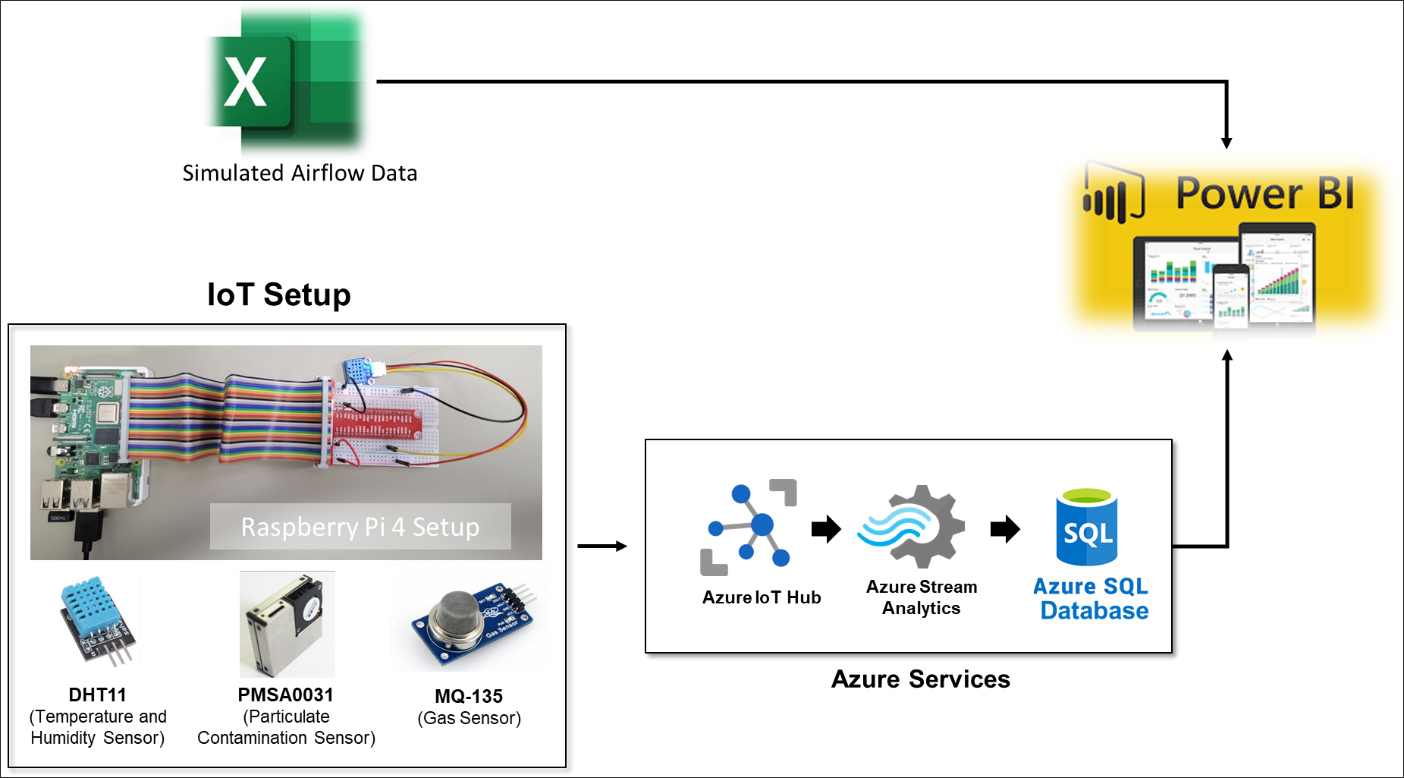
Sensor data from the Raspberry Pi4 must first be transferred and stored in a spreadsheet or a database before it is linked to the model in MS Power BI Desktop. Users can define the frequency of the data collected and exported. The study looked into exporting the data directly to an Excel spreadsheet. The study also looked into exporting the data to Azure IoT Hub and then streaming and storing the data into Azure SQL database using Azure Stream Analytics. A third option includes using Azure Stream Analytics to stream the data to the cloud where it can be processed directly using MS Power BI Service without the need to store it in a database. This option was not considered. Figure 12 shows the workflow for transferring air quality parameter data from Excel and Raspberry Pi 4 to MS Power BI.
The following sections explain how to export data from the Raspberry Pi 4 to both Excel and Azure IoT Hub.
Option-1: Export DHT11 Data to Excel
As shown in figure 13, Python code was written to capture and store temperature and humidity data from the DHT11 sensor in an Excel spreadsheet. The code specifies to capture the data every 15 minutes and generate a new Excel file every 24 hours.
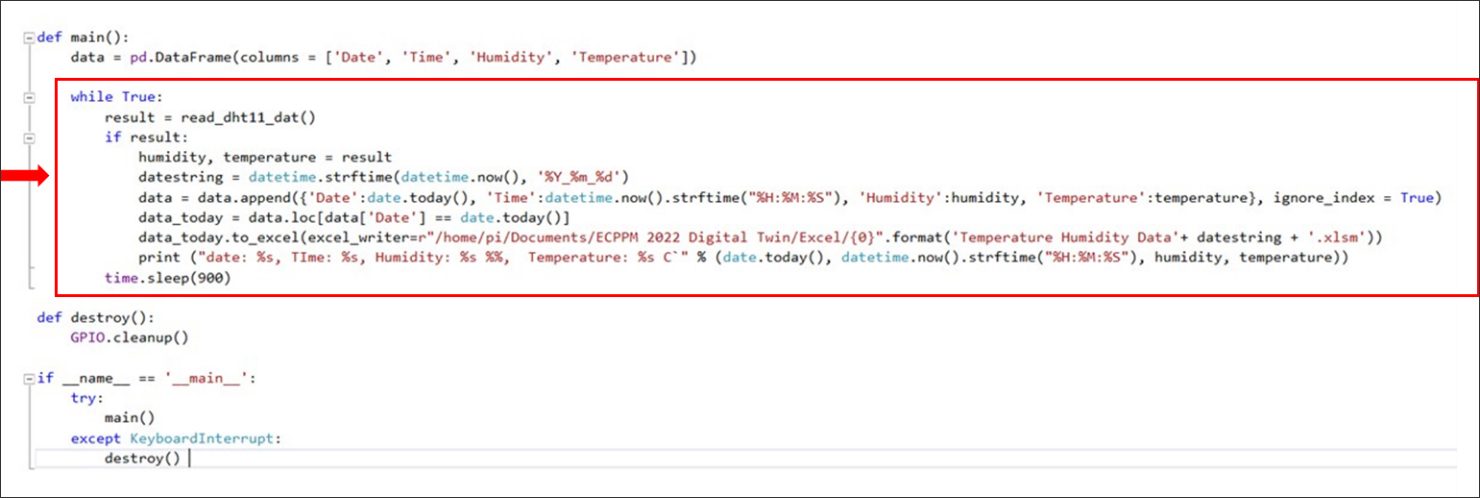
The code also included statements to add a date and time column to track when the data was captured. The code also specifies an output name for the Excel file.
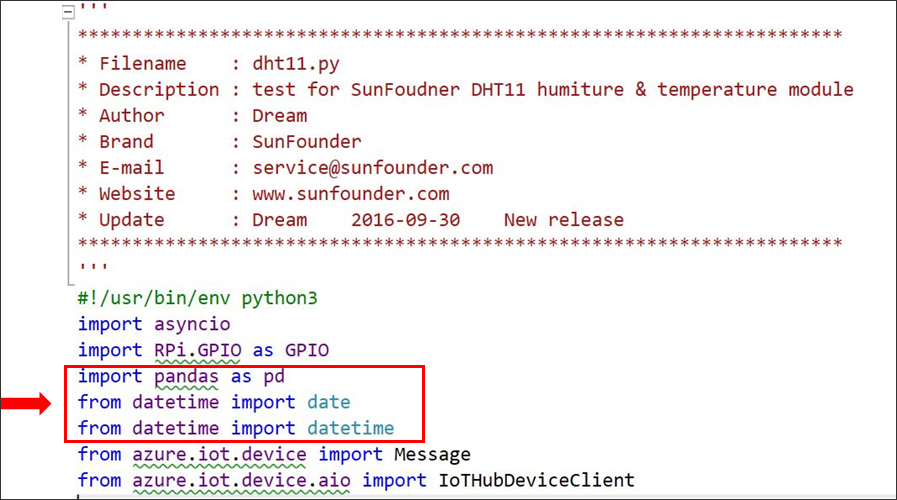
To execute the code in figure 13, the authors had to download common Python libraries like Pandas and DateTime to the Raspberry Pi 4 and import these libraries to the SunFounder Python code for the DHT11 (figure 14).
Option-2: Export DHT11 Data to Azure IoT Hub
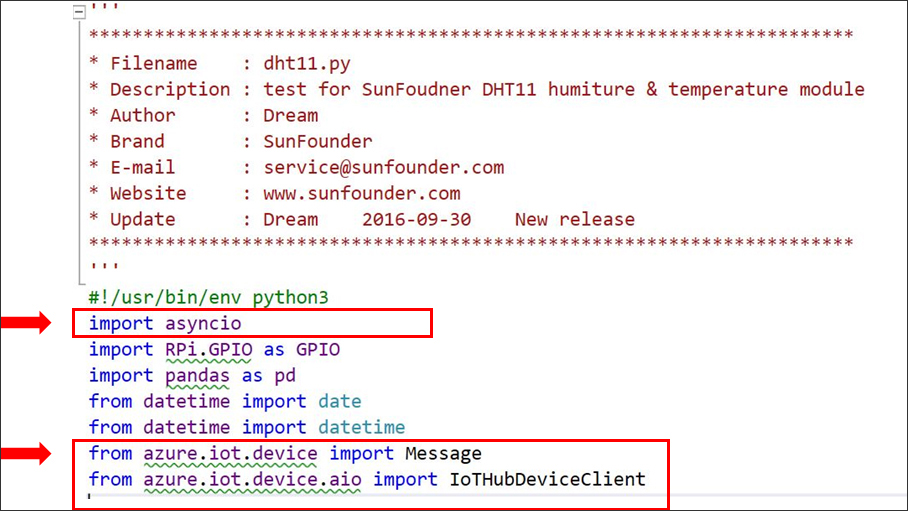
Using an open-source code provided by [Reference: Jevpankov, 2021], temperature and humidity data from the DHT11 sensor is sent as a message to a dedicated Azure IoT Hub. Microsoft provides a Python package for transmitting sensor data to its IoT Hub through an asynchronous client. The package is called “azure.iot.device.aio.” Using the Python package, the azure.iot.device.aio and asyncio libraries were first downloaded to the Raspberry Pi 4 and imported to the SunFounder Python code for the DHT11 as shown in figure 15.
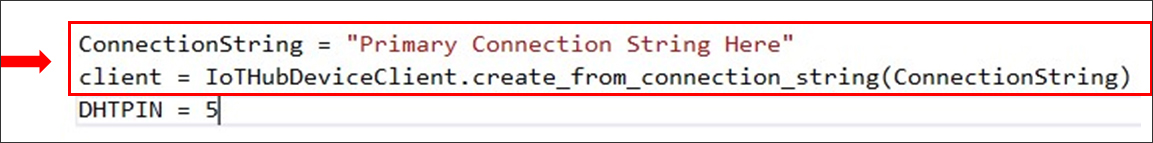
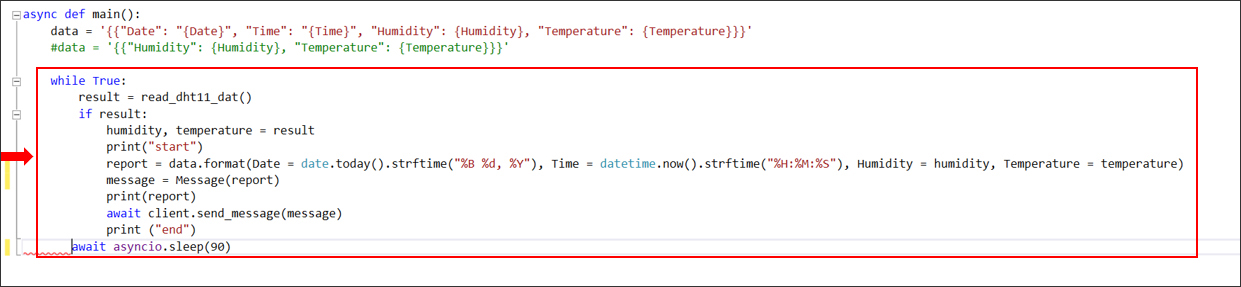
To export the data to the Azure IoT Hub, a two-part Python code was written: one to establish the connection to a specific IoT Hub (Figure 16) and the other to send the sensor data as messages to the connected IoT Hub device (Figure 17). Each data row collected and stored in every parameter table for each sensor is sent as an individual message to the Azure IoT Hub device.
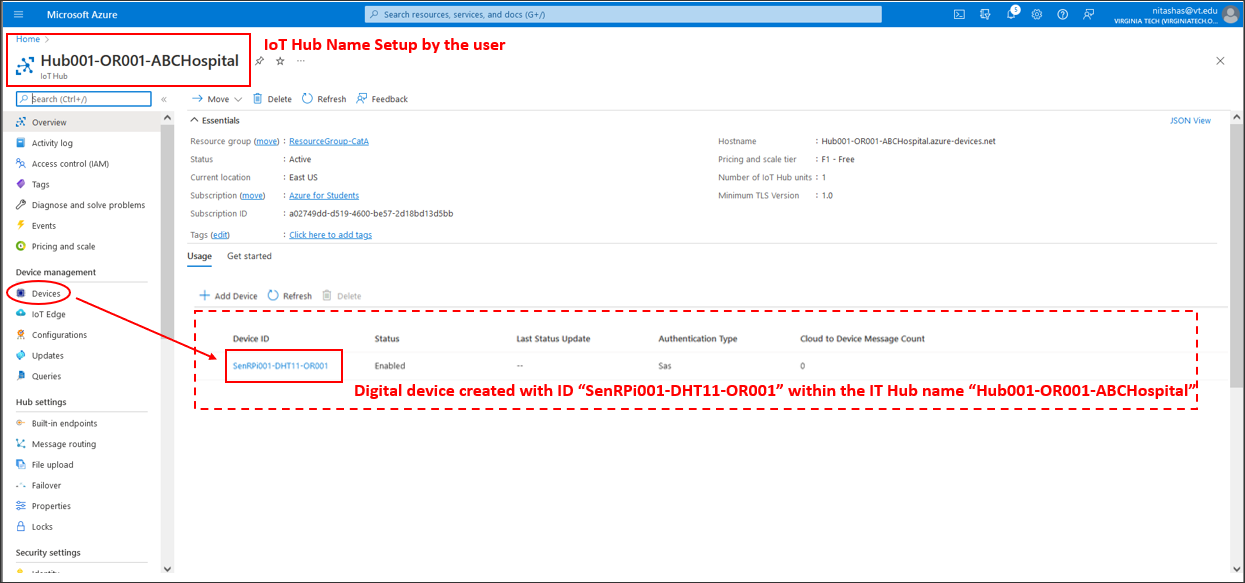
Before the code can be executed, one or more digital devices are set up in the Azure IoT Hub to receive sensor data from the Raspberry Pi 4 in the form of messages. The digital device ID is user-defined. We created one digital device with ID number SenRPi001-DHT11-OR001. The format for the device ID defined included three parts. The first part denotes a sensor ID (SenRPi001), the second part is the sensor type used from which the data is transmitted (DHT11), and the third part is the room number where the data is collected (OR001).
The digital device created generates a unique “Primary Connection String”. This string is added to the Python code to establish the connection between the Raspberry Pi 4 and the Azure digital device. Figure 18 shows the Azure digital device created within the Azure IoT Hub. The Azure IoT Hub will start receiving messages from the Raspberry Pi 4 once the Python code is executed.
While executing this code, users need to make sure that they enter the correct primary connection string for the digital device within the Azure IoT Hub to which they want to transfer the data, and that the data being transmitted is either a string or a float data type. If the user is transferring date or time data to Azure IoT Hub, it needs to be converted into the string format.
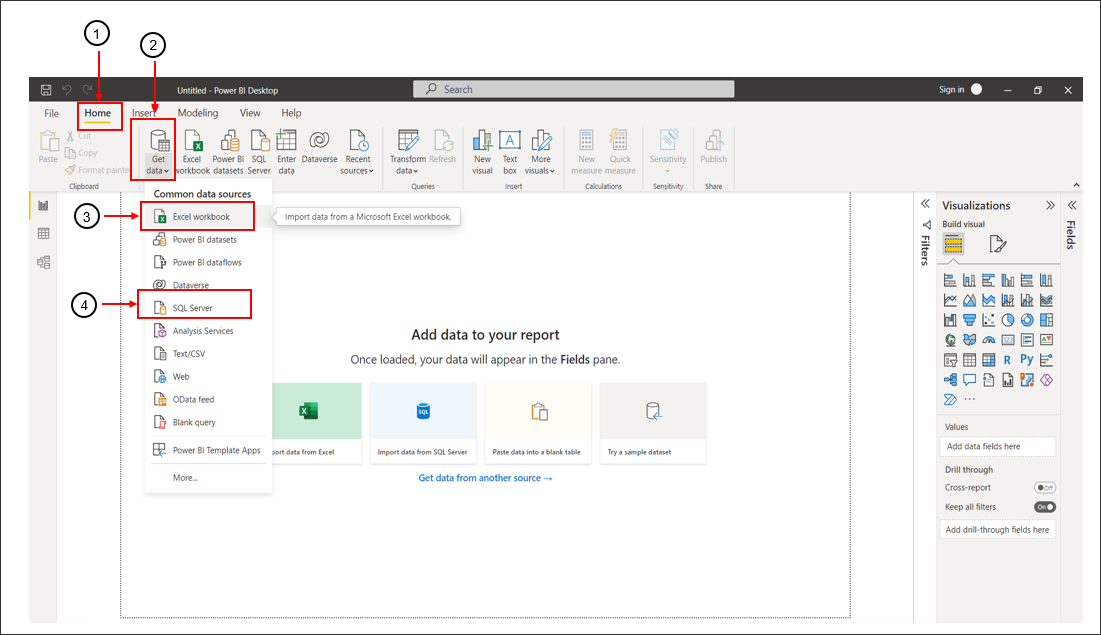
Power BI allows importing data from many different sources including Excel and SQL databases. Users can import data into Power BI using the “Get Data” function (Figure 19).
As shown in Figure 19, to import the simulated airflow data from Excel or SQL Database, select the “Excel workbook” (3) or “SQL Server” (4) option as the data source from the “Get Data” function (2) under the “Home” tab (1). After selecting the “Excel workbook” as a data source, the Excel file containing the simulated airflow data is loaded into Power BI. If an Excel file contains multiple workbooks, users can specify which workbook they would like to import into Power BI. Each workbook is imported as a separate table.
Sensor data for N2O, particulate contamination, temperature, and humidity are exported as messages to Azure IoT Hub. To import these messages as data into Power BI, the messages need to be stored in the Azure SQL database and then imported into Power BI (shown earlier in Figure 12).
Microsoft Azure is a cloud computing service provided by Microsoft and includes a suite of services that can assist users to connect, monitor, and control IoT and edge devices. For this study, three Azure services were utilized: Azure IoT Hub, Azure Stream Analytics, and Azure SQL Database.
All messages received by Azure IoT Hub for sensor data are transferred and stored in the Azure SQL database using Azure Stream Analytics. An Azure SQL database with a firewall is created allowing Azure Service to save the data messages in the SQL database. The SQL database ID is also user-defined.
Once the database is created, data from Azure IoT Hub is streamed to the database. This is achieved by utilizing Azure Stream Analytics. Azure Stream Analytics creates a table within the Azure SQL database and streams and stores live data from Azure IoT Hub into the table. Azure Stream Analytics also allows users to process the data before storing it into a SQL table using SQL queries. Once the data starts populating into the SQL table, these tables can be imported into Power BI using the “Get data” function and selecting “SQL Server” as the data source. Users can import SQL tables as direct queries allowing Power BI to automatically refresh the imported table at user-defined intervals.
Once the data for all the sensors are imported into Power BI, the 3D model for the OR needs to be imported into the Power BI as well to allow for the association/linking of sensor data to the respective 3D elements. The importing of the 3D model into Power BI is achieved using a third-party service called VCAD. Blogics s.r.l. VCAD platform can be used to generate a Power BI template for IFC, Navisworks, or Revit Model graphics along with embedded data.
Revit and IFC models can directly be uploaded to VCAD’s webpage to generate a ready-to-use Power BI template that includes 3D model elements and any embedded data. To generate a Power BI template for a Navisworks model, the users need to first link their Autodesk Forge account to VCAD and then upload the Navisworks model. The Power BI template generated using VCAD comes with the open 3D model viewer and VCAD_Asset and VCAD_Properties tables which contain the data embedded in the 3D model. Users can connect their Autodesk Forge account with VCAD to utilize the Forge 3D viewer in Power BI instead of the open 3D viewer.
Once the Power BI template for the OR model was generated using VCAD, the authors imported the sensor data into the generated Power BI template using the steps above.
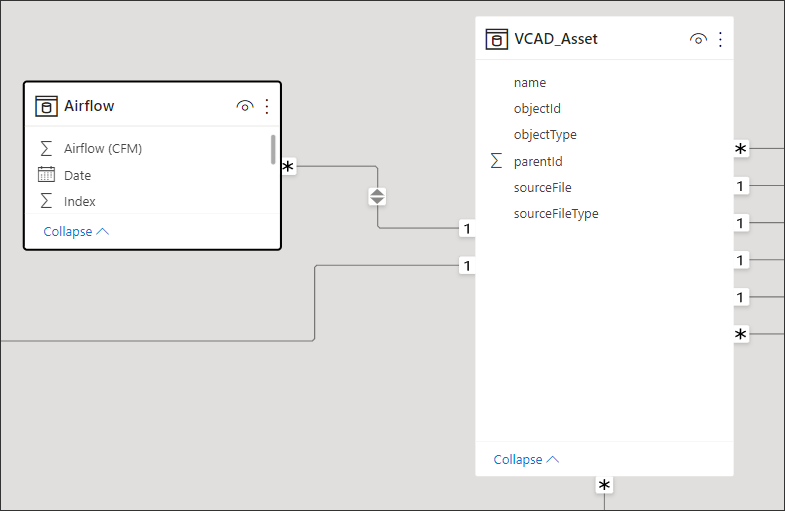
Power BI allows users to link data imported from multiple data sources together using a common column. The VCAD_Asset table present in the Power BI template generated for the OR model includes a unique object ID for all model elements. Sensor data imported from the SQL database and the Excel file can then be linked to their respective model elements by adding a column called “ObjectId” in the sensor data tables and populating it with the object ID values of their respective model elements. A many-to-one relationship is established between the VCAD_Asset table and the sensor tables to link them together. Figure 20 shows the relationship between the VCAD_Asset and airflow table.
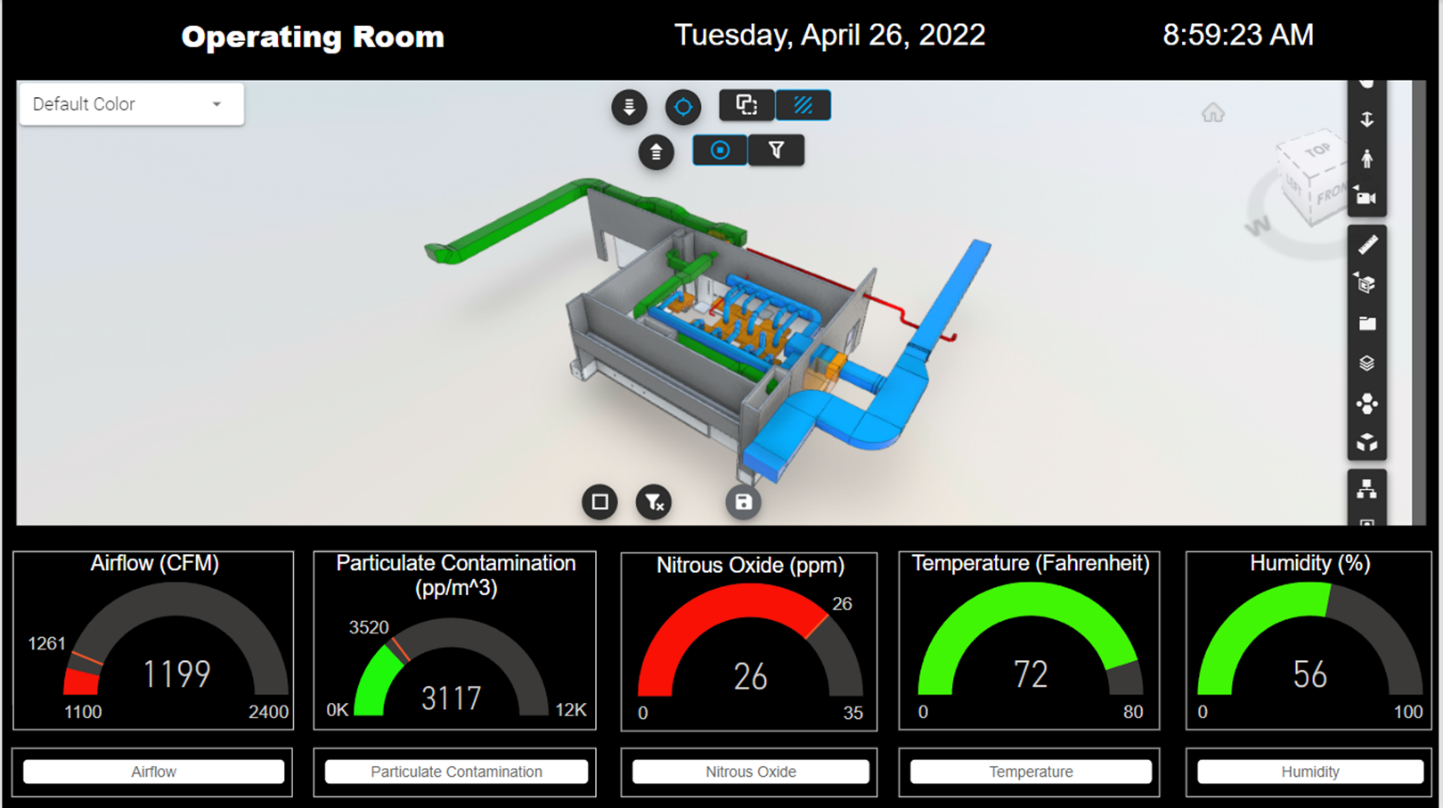
Power BI visualization tools are used to create dashboards to monitor the air quality key parameters data in the OR. Dashboards are one form of representation of the Digital Twin of the physical operating room.
Figure 21 shows the example dashboard created displaying the OR 3D model and linked air quality data transmitted in near real-time. The dashboard interface is divided into three main areas. The top area of the interface shows the current date and time. The OR 3D model is displayed in the center of the dashboard and can be navigated using various Forge navigational tools available with the Power BI interface. The bottom area of the interface displays readings of N2O, temperature, humidity, airflow, and particulate contamination data captured from sensors. These readings are shown using Power BI’s Gauge visualization tool. Each gauge is designed to show readings in green when values are within the user-defined permissible limit (set point) and in red when values exceed the set point. For example, as shown in figure 21, readings for airflow (cfm) and nitrox oxide (ppm) are displayed in red indicating that the current values have exceeded the set point defined for the OR room.
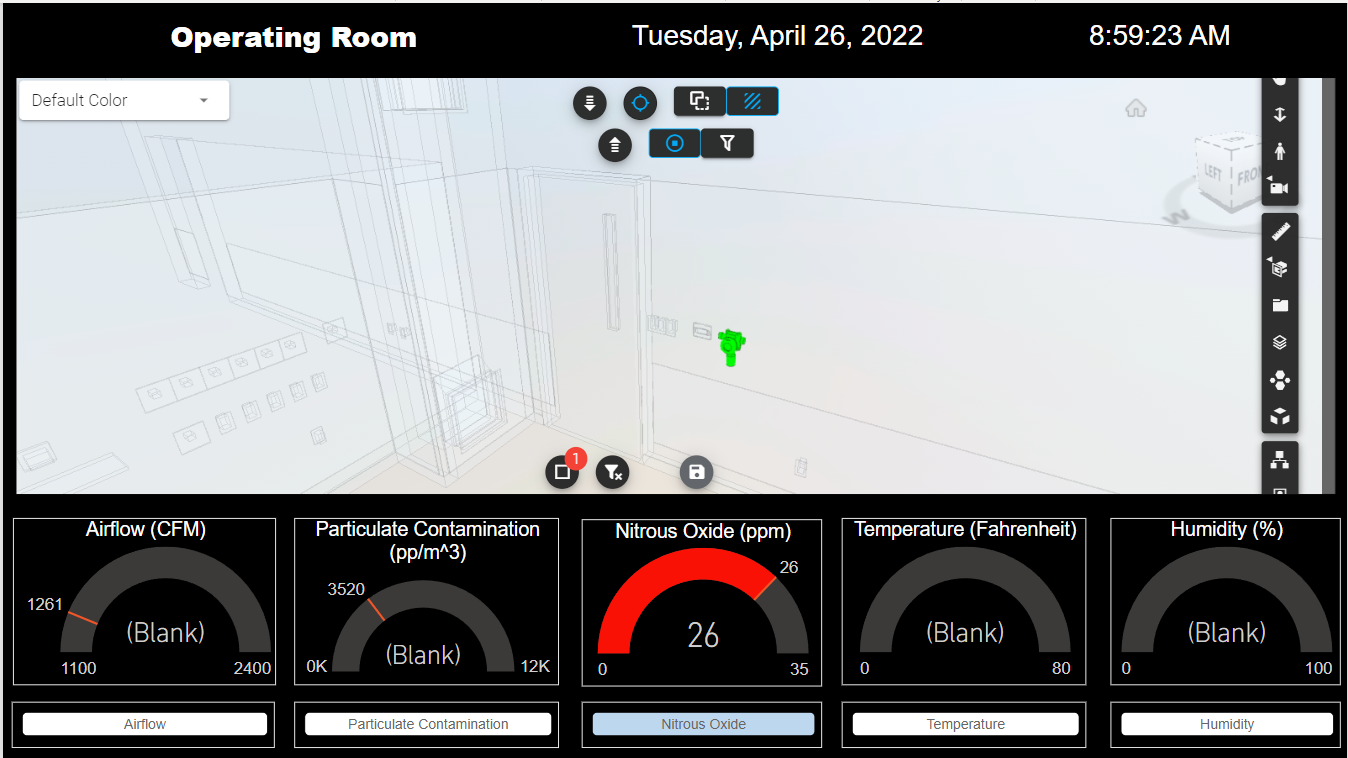
As shown in figure 22, clicking the buttons at the bottom of the dashboard screen below the gauges allows users to zoom in and highlight the sensor in the 3D model to determine its location.
The authors have created a low-level (descriptive) Digital Twin that allows visualizing and monitoring five key parameters that measure the air quality in a healthcare facility operating room suite. Data captured from various sensors or simulated are transmitted to the Digital Twin Power BI platform using the Raspberry Pi 4 and Azure Services. This implementation provides vital, near-real-time monitoring of the air quality within a critical space of a facility.
There are several key data considerations any organization needs to consider when developing Digital Twins. Maintaining data integrity is critical to ensure that insights and decisions can be made on trusted data. There are also security concerns surrounding the data transmitted through the cloud. Azure Services were used in this study to transfer sensor data to the cloud. Our investigation shows that Azure Services provide users with varying levels of security options at varying pay levels so that users can use the proposed workflow to develop Digital Twins for their facilities while fulfilling their security requirements [Reference: Lanfear, 2022] Additionally, not all data is relevant for operational use and data needs vary across organizations and use cases. It is important to understand and decide on what data sources and what data points are necessary to include in the Digital Twin implementation.
Data interoperability is also very vital across the different platforms required for creating a Digital Twin. There is still no “one size fits all” solution for developing Digital Twins and users are required to integrate a multitude of solutions to capture transfer, store, display, analyze the data and make corrective decisions and display Digital Twins. Different open and proprietary standards and exchange formats require users to take careful consideration when adopting hardware and software solutions for their implementations.
Future research by members of the Virtual Facilities Research Lab (VFRL) at Virginia Tech includes investigating and implementing data analytical capabilities to the Digital Twin that can assist with fault detection and diagnostics, generating insights, and creating self-learning systems capable of optimization decisions through machine learning and artificial intelligence. This will improve the Digital Twin maturity level discussed in this article by creating a higher-level Digital Twin that can support the facility better and continue the transformation journey.
 Ashit Harode is a Ph.D. candidate in the Department of Building Construction at Virginia Tech. He holds a master’s degree in construction management from Virginia Tech. His research interest includes Building Information Modeling (BIM), Machine Learning, Digital Twin, and its application in construction automation and facility management.
 Walid Thabet is a 25+ year faculty veteran of Virginia Tech and has been teaching and developing construction, construction management and construction technology courses at the undergraduate and graduate levels. His research agenda focuses on Virtual Design and Construction (VDC), Construction Innovation, BIM and Digital Twins/Digital Transformation to support Facility Management. Dr. Thabet leads the Virtual Facilities Research Lab (VFRL), offering emerging CRE leaders hands-on experience in technology development and practical application as well as access to industry through both corporate and academic partnerships. Along with the academic impact that the VFRL has on curriculum and student support, the lab collaborates with industry partners on external projects. .
 Michael B. DuLaney is the BIM Manager for UCHealth, a twelve hospital healthcare provider in Colorado. Mike has been implementing a BIM-centric approach for managing UCHealth’s facilities since 2015. Mike’s initiatives include purchasing and implementing an integrated workspace management system (IWMS) and a computerized maintenance and management system mobile application (CMMS). Mike previously was a VDC manager for a major CM/GC and one of his projects, the Ft. Belvoir Community Hospital, had a congressionally mandated end date and won the Washington, D.C. AGC Best Use of BIM, Projects $150M or more. The project was 1.3M SF and $940M. Mike holds a BS degree, Information Systems Management, summa cum laude.
AECbytes content should not be reproduced on any other website, blog, print publication, or newsletter without permission.
Have comments or feedback on this research paper? Visit its AECbytes blog posting to share them with other readers or see what others have to say.
AECbytes content should not be reproduced on any other website, blog, print publication, or newsletter without permission.