


Last month, I heard of the launch of vPlanner, a new visual planning tool developed by Ghafari Associates to facilitate collaborative project management. In our industry, it is quite unusual for an AEC firm to develop and launch a software tool—so when that happens, it is both intriguing and noteworthy. In particular, Ghafari Associates is well-known for its advanced implementation of AEC technologies (see the article, Multi-Disciplinary BIM at Work at Ghafari Associates) as well as its professional work in multidisciplinary design, technology consulting, construction management, lean construction, and IPD projects. For example, Ghafari was the Lean/BIM project integrator for the Sutter Medical Center Castro Valley, which was an IPD project (see the AECbytes article describing this project in detail). With such a distinguished track record in the field, it seems likely that vPlanner will prove to be an effective tool for managing AEC projects, given that it embodies Ghafari’s own processes and workflows. When I learnt that vPlanner was actually being used by Ghafari Associates for an IPD project in the San Francisco Bay area where I am based, I decided to check it out and see first-hand how it works on a project.
Ghafari Associates was founded in 1982 and currently has over 400 employees worldwide. The main industries it serves are the aviation, commercial, education, government, healthcare and industrial / manufacturing sectors, and in addition to its architectural and engineering work, it is often brought in to facilitate technology implementation, model management, coordination, construction management, and the application of lean principles on a project. It developed vPlanner around the methodologies and best practices that it has itself used to successfully manage a number of 3D-enabled, highly collaborative projects that embrace lean principles, such as the $320-million Sutter Health Eden Medical Center, for which Ghafari served as the integration manager and lean consultant. Many of these projects have achieved impressive metrics related to quality, schedule, cost and safety, which serves as a credible testimonial to the principles embodied in vPlanner.
vPlanner was developed in-house at Ghafari, and a beta version has been available since May 2012 to a group of early adopters, including owners, contractors, architects, and engineers from around the country. These early adopters deployed the application on various projects including IPD healthcare projects in the US and Canada, EPCM (Engineering, Procurement and Construction Management) projects in Salt Lake City in the mining industry, as well as a number of multi-disciplinary in-house projects at Ghafari. Last October, Ghafari introduced the application to attendees at the 14th annual Lean Construction Institute Congress, which included some of the A/E/C industry’s greatest champions of lean principles. It was officially launched last month and is available for annual licensing on a project-by-project basis or through a multi-project enterprise subscription.
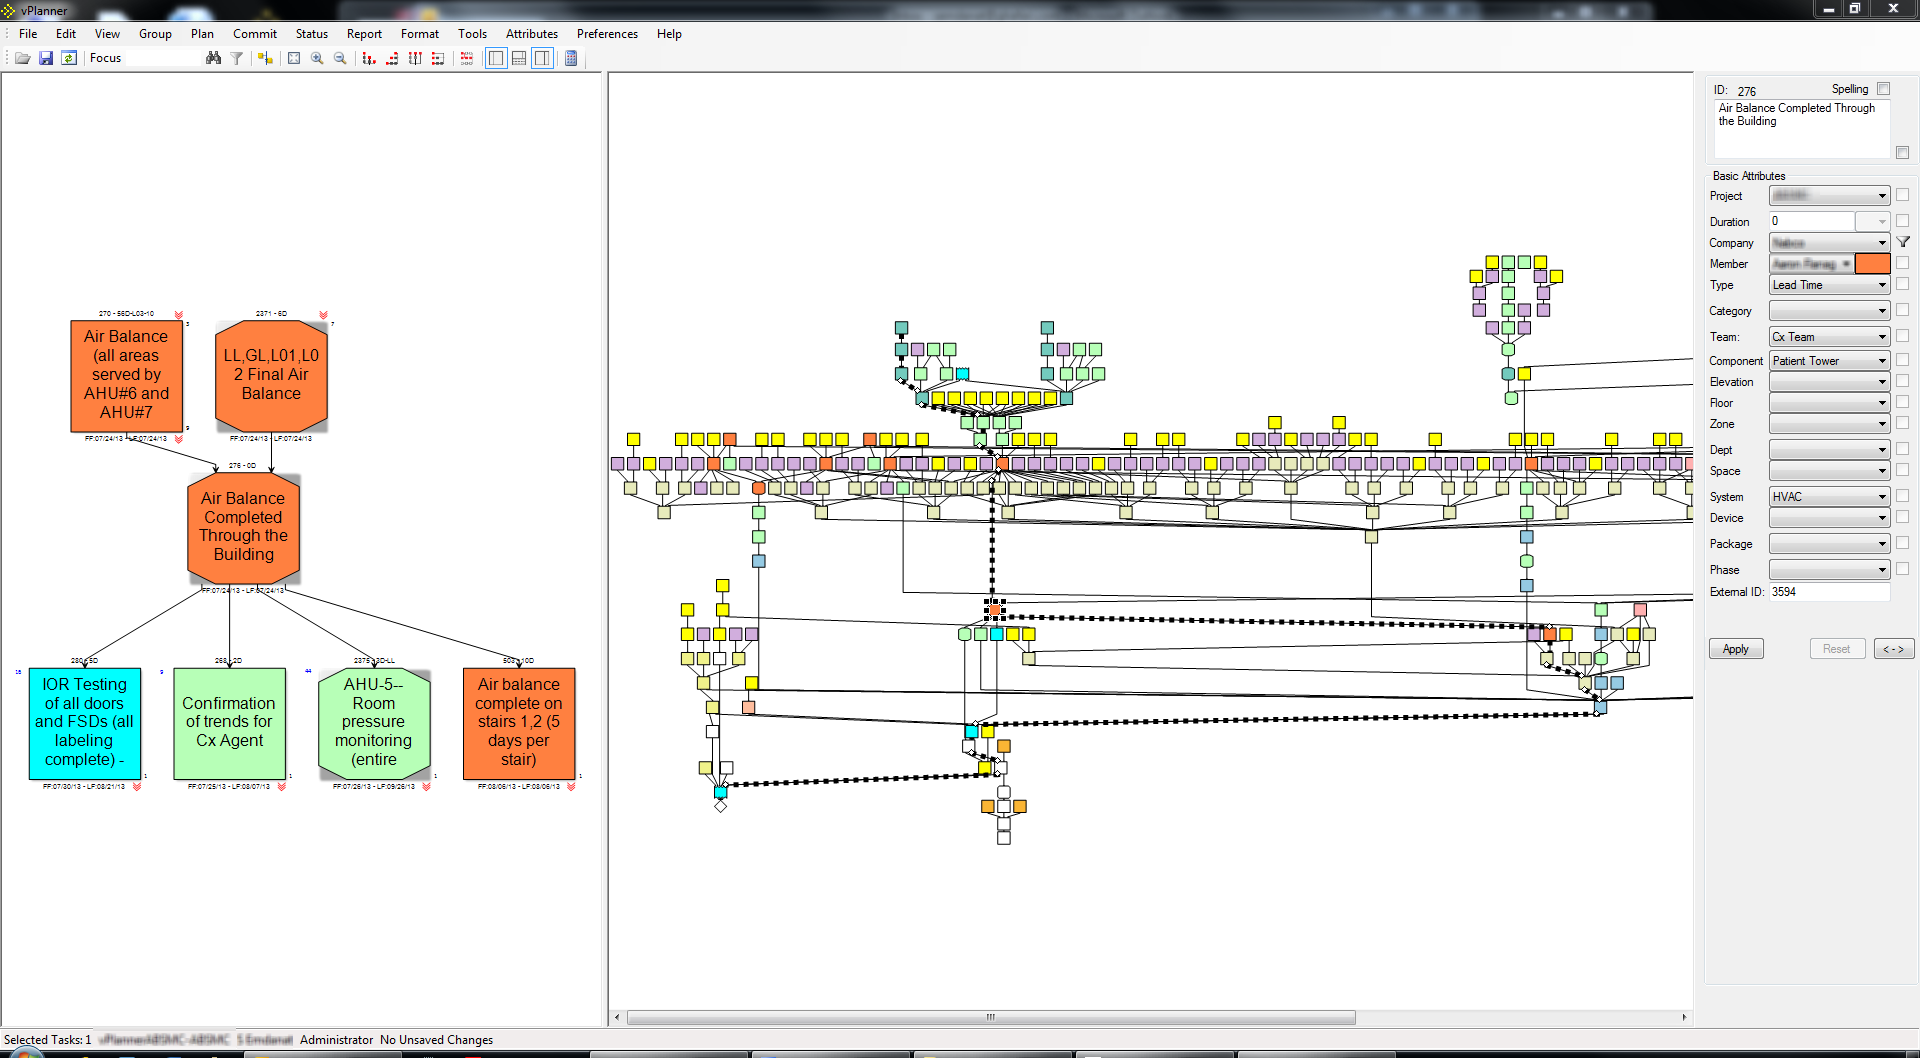
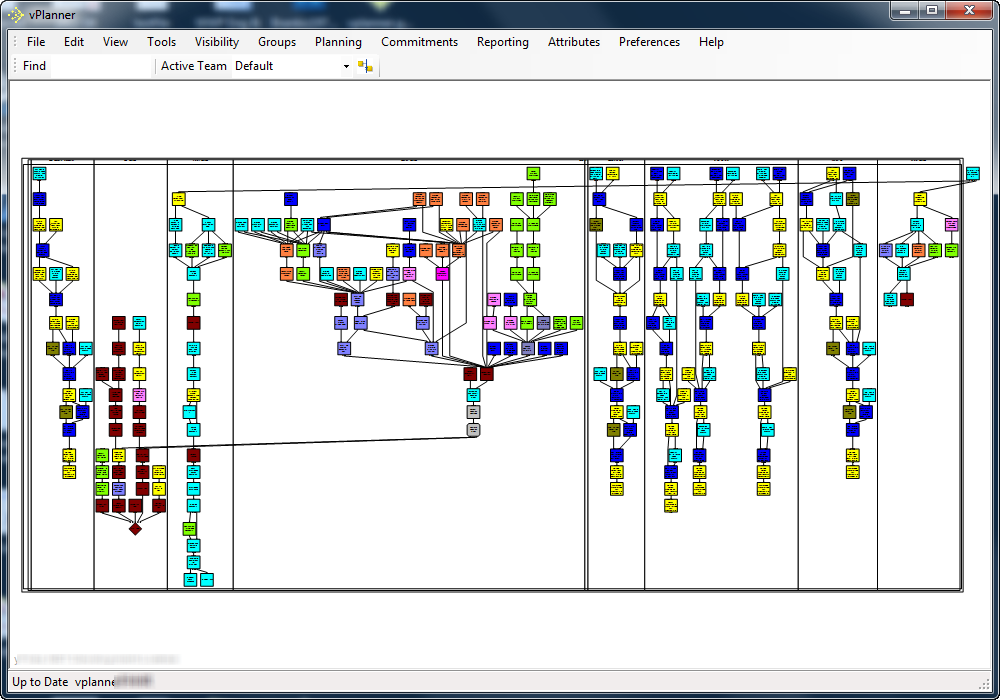
vPlanner is designed to streamline project pull-planning activities, particularly in multi-disciplinary scenarios where there are overlapping criteria and complex deliverables, for which transparency of the overall project plan and its dependencies is critical. It does this by providing a visual interface (shown in Figure 1) for adding virtual “post-it notes” and supplementing them with scheduling, tracking and reporting capabilities. vPlanner is primarily a client-server application, and as the project data resides centrally on a server, it can be remotely accessed by multiple users concurrently, enabling them to collaborate on developing the project plan. Other key features of the solution include multi-attribute visual task fillers, visual groups, real-time layouts, forecasting, last responsible moment calculation, critical path visualization (see Figure 1), timeline views, task reports, and plan completion tracking and reporting.
Let’s look at some of the key features of vPlanner in more detail.
The core feature of vPlanner, the heart of its development, is visual planning. You really have to visit the job trailer at a construction site to appreciate the amount of planning logistics that are required to execute a construction project—so many different players are involved, each of them required to undertake a variety of different tasks, and very often, the tasks are related to one another, making it essential for some tasks to be completed before others can be started. Each task is budgeted with a specific duration, and the project plan needs to take into account which tasks can be undertaken in parallel and which need to be completed before others can start. Based on this, the project schedule is drawn up, and the estimated project completion date is determined. The project schedule is forced to be dynamic, because it has to take into account the tasks that are running longer or those that are completed ahead of time (the former is a lot more common than the latter). As a result, the project schedule has to be updated almost on a daily basis. This is where the benefit of an application like vPlanner, with its visual planning capabilities, comes in. It allows all the players in the construction team to easily see all the tasks they need to accomplish, in what time frame, how their tasks affect the tasks of other players, and vice versa. They can also frequently meet up with the other players and go over the project plan, updating it when needed. Since the tasks that are completed are no longer on the project plan, they can see an updated sequence of their task list daily to be well prepared for their next set of tasks.
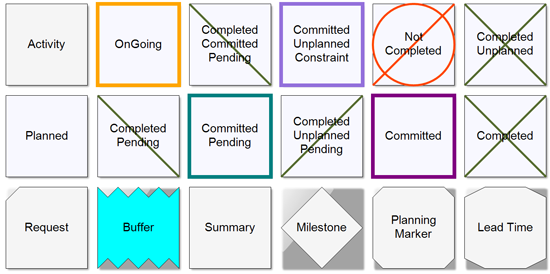
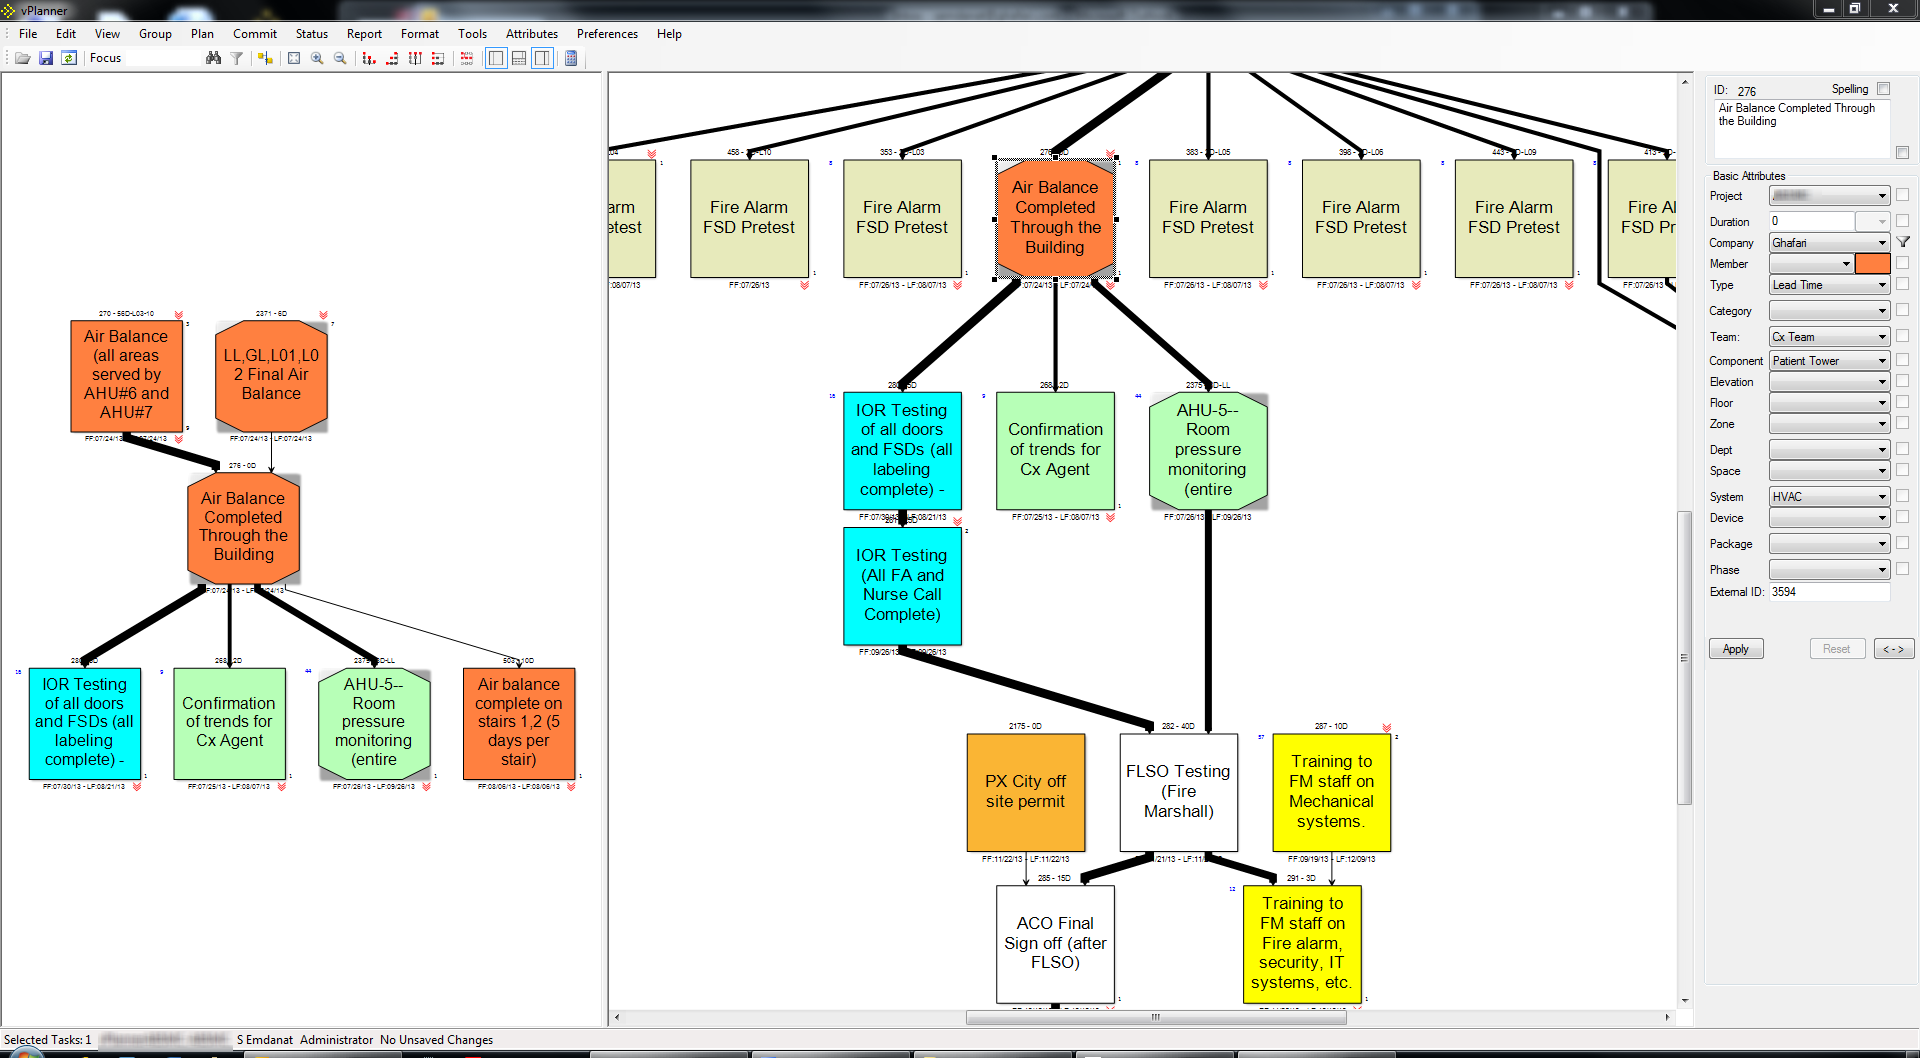
vPlanner is essentially a diagramming tool specific to construction that has a library of different symbols, each visually representing a different task type and its status indicator. All the symbols in vPlanner are shown in Figure 2. In addition, the symbols are also illustrated in different colors, with each color representing the specific project team or lead player in charge of it. This was illustrated in the project plan shown in Figure 1. Each task (referred to as “Activity” in vPlanner) is associated with an ID number, duration, floor, department, and various other properties, which can be specified in the Properties panel shown in Figure 1.
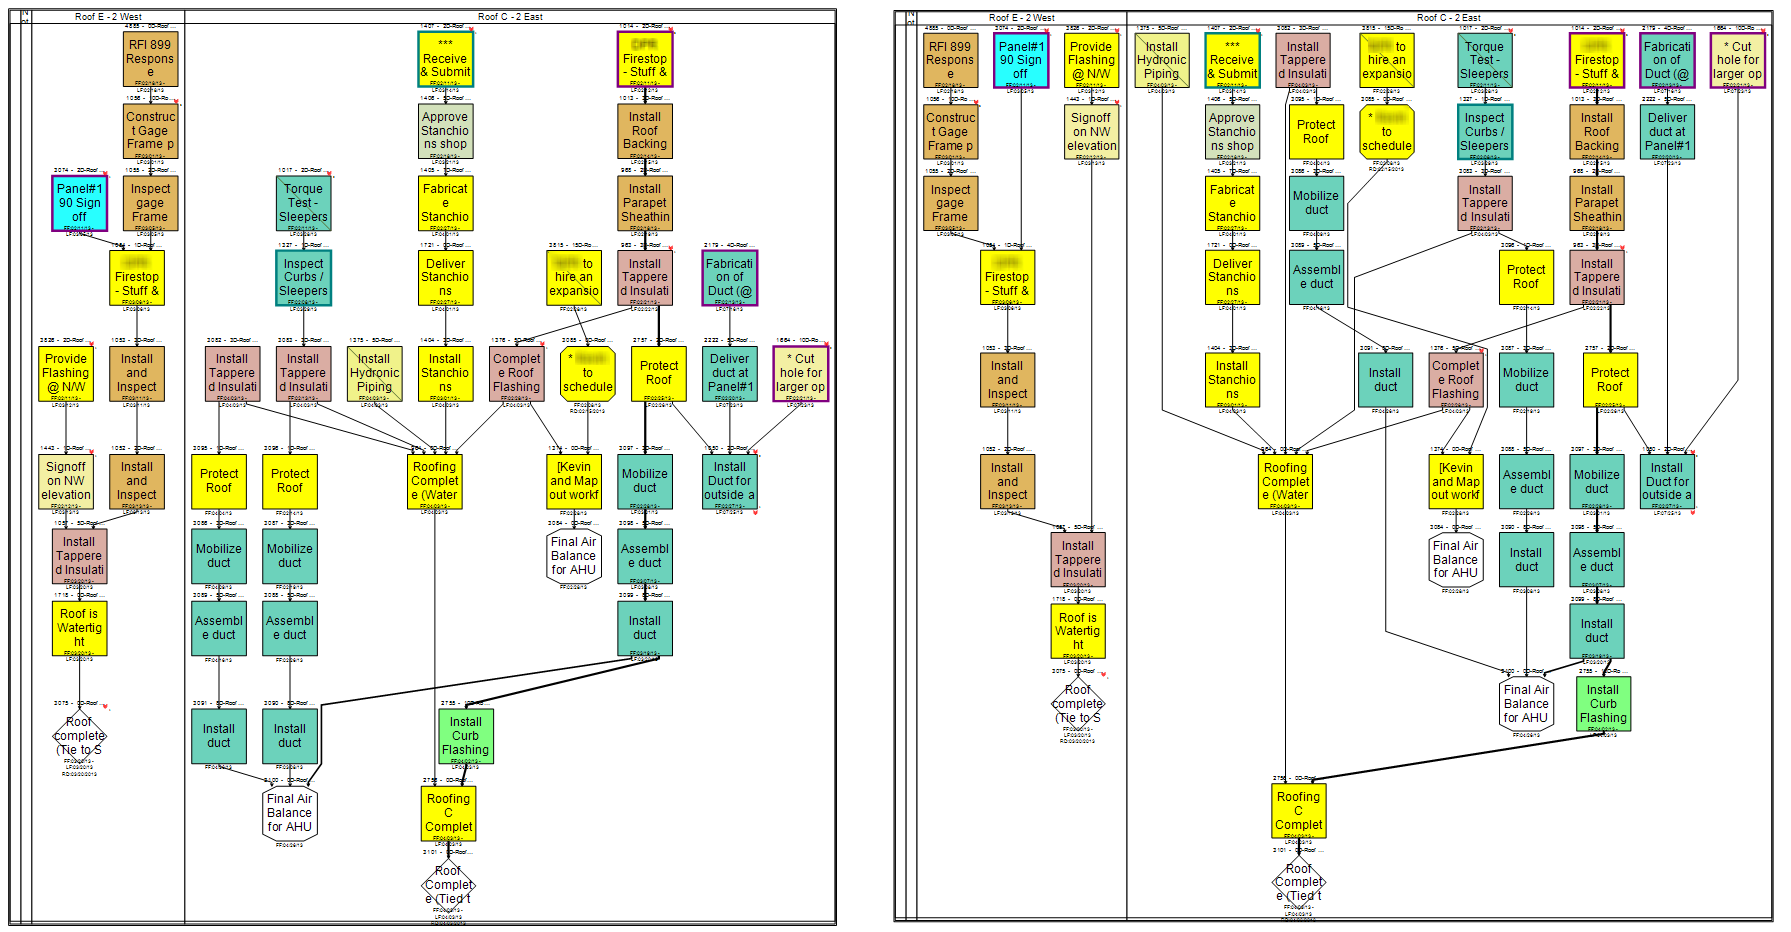
The tasks are connected by arrowed lines showing the sequence in which they need to be performed. However, this can be changed to see the sequence in different ways. For example, two views of the same tasks can be seen in Figure 3. The left image shows an automatic layout in vPlanner that focuses on the overall logic of the plan. Tasks remain closest to their neighboring tasks. In the right image, the same tasks are automatically arranged so that the tasks without any constraints float to the top for easy review. This view also helps team members get a better idea of what all the commitments are, what their status is, and which ones are on their plate.
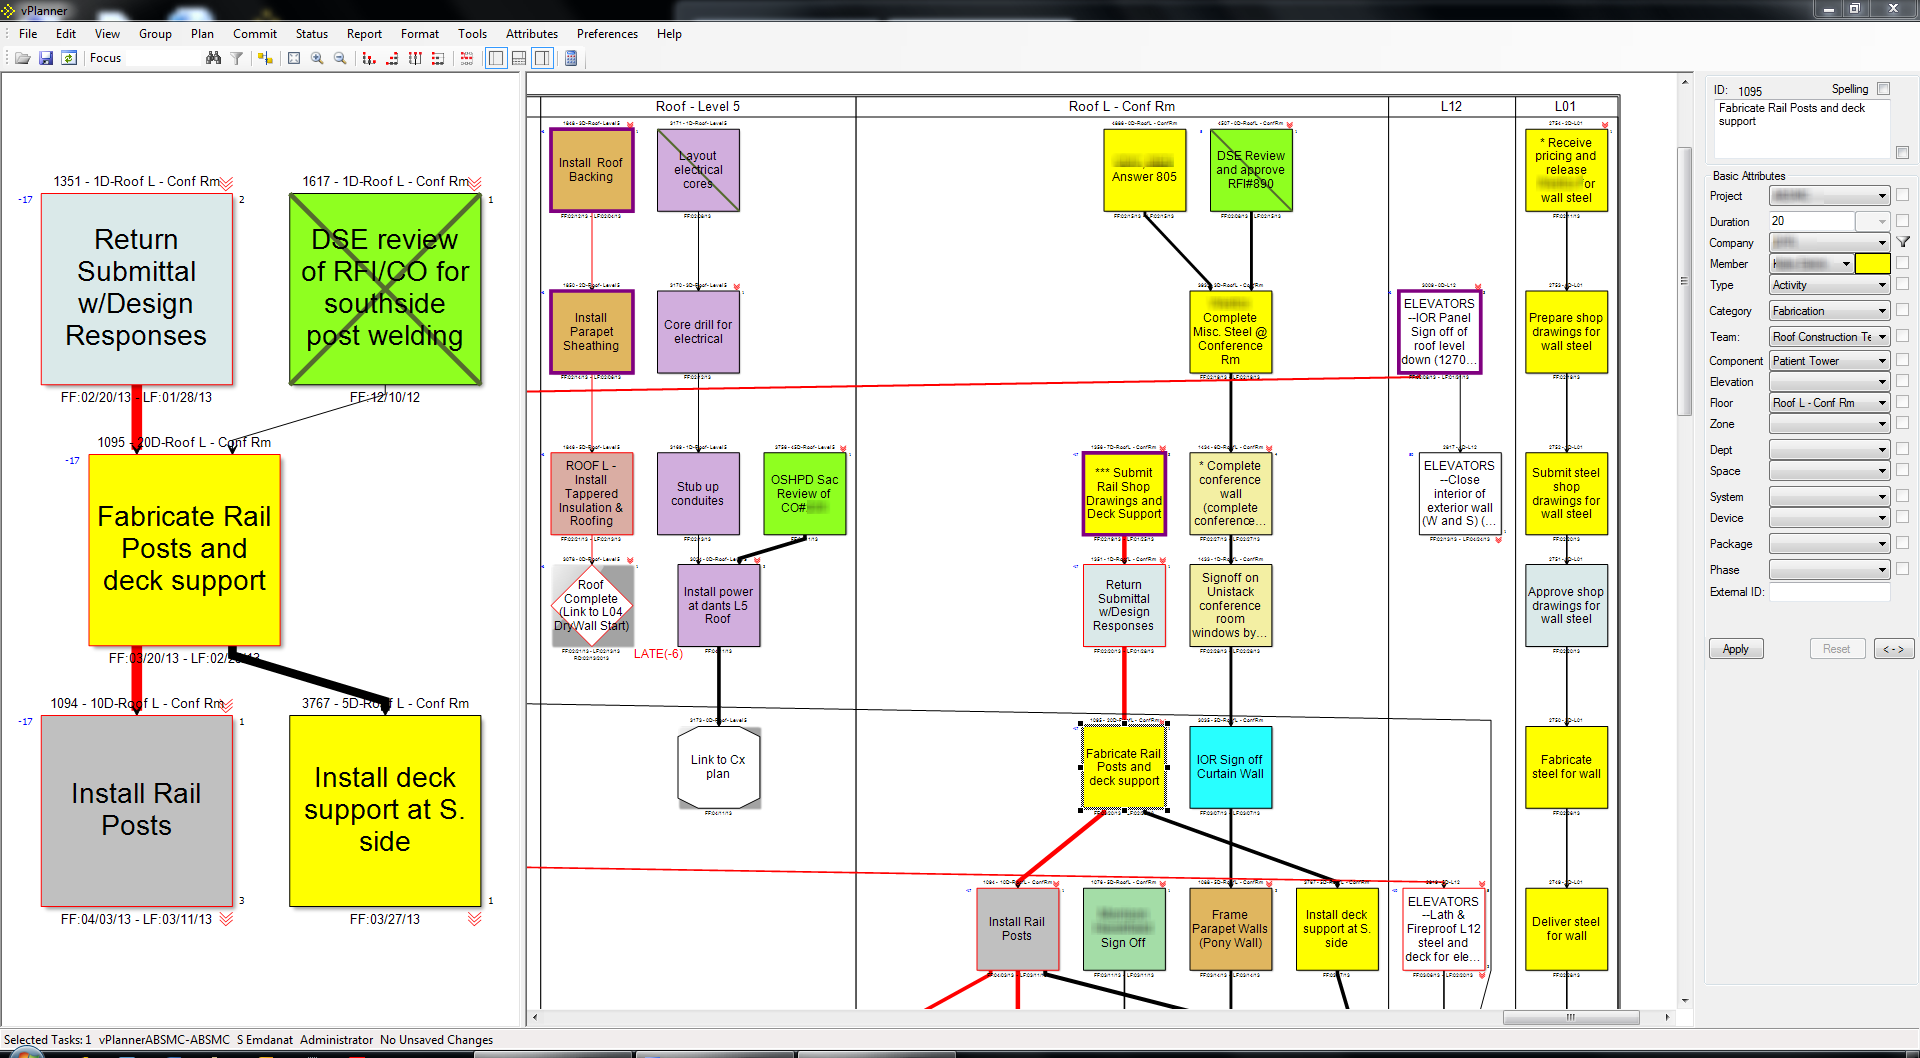
There are various other ways to visualize the project plan in vPlanner. For example, Figure 4 shows how the application interface can be divided to show the main plan in one view and isolate a selected task and its immediate predecessors and successors in another view. Users have the option to filter and expand the predecessors and successors of a task to better understand the overall plan logic. Another example is shown in Figure 5, with a user defined swimlane layout of the project plan—a common requirement in construction planning. Tasks are organized in hierarchical swim lane layout views based on user defined swim lanes, and can be arranged based on floors and then zones, or floors and then spaces. Yet another example is shown in Figure 6, where the length of the path between tasks is represented as a normalized path thickness—the heavier the line, that longer the path based on its overall duration.
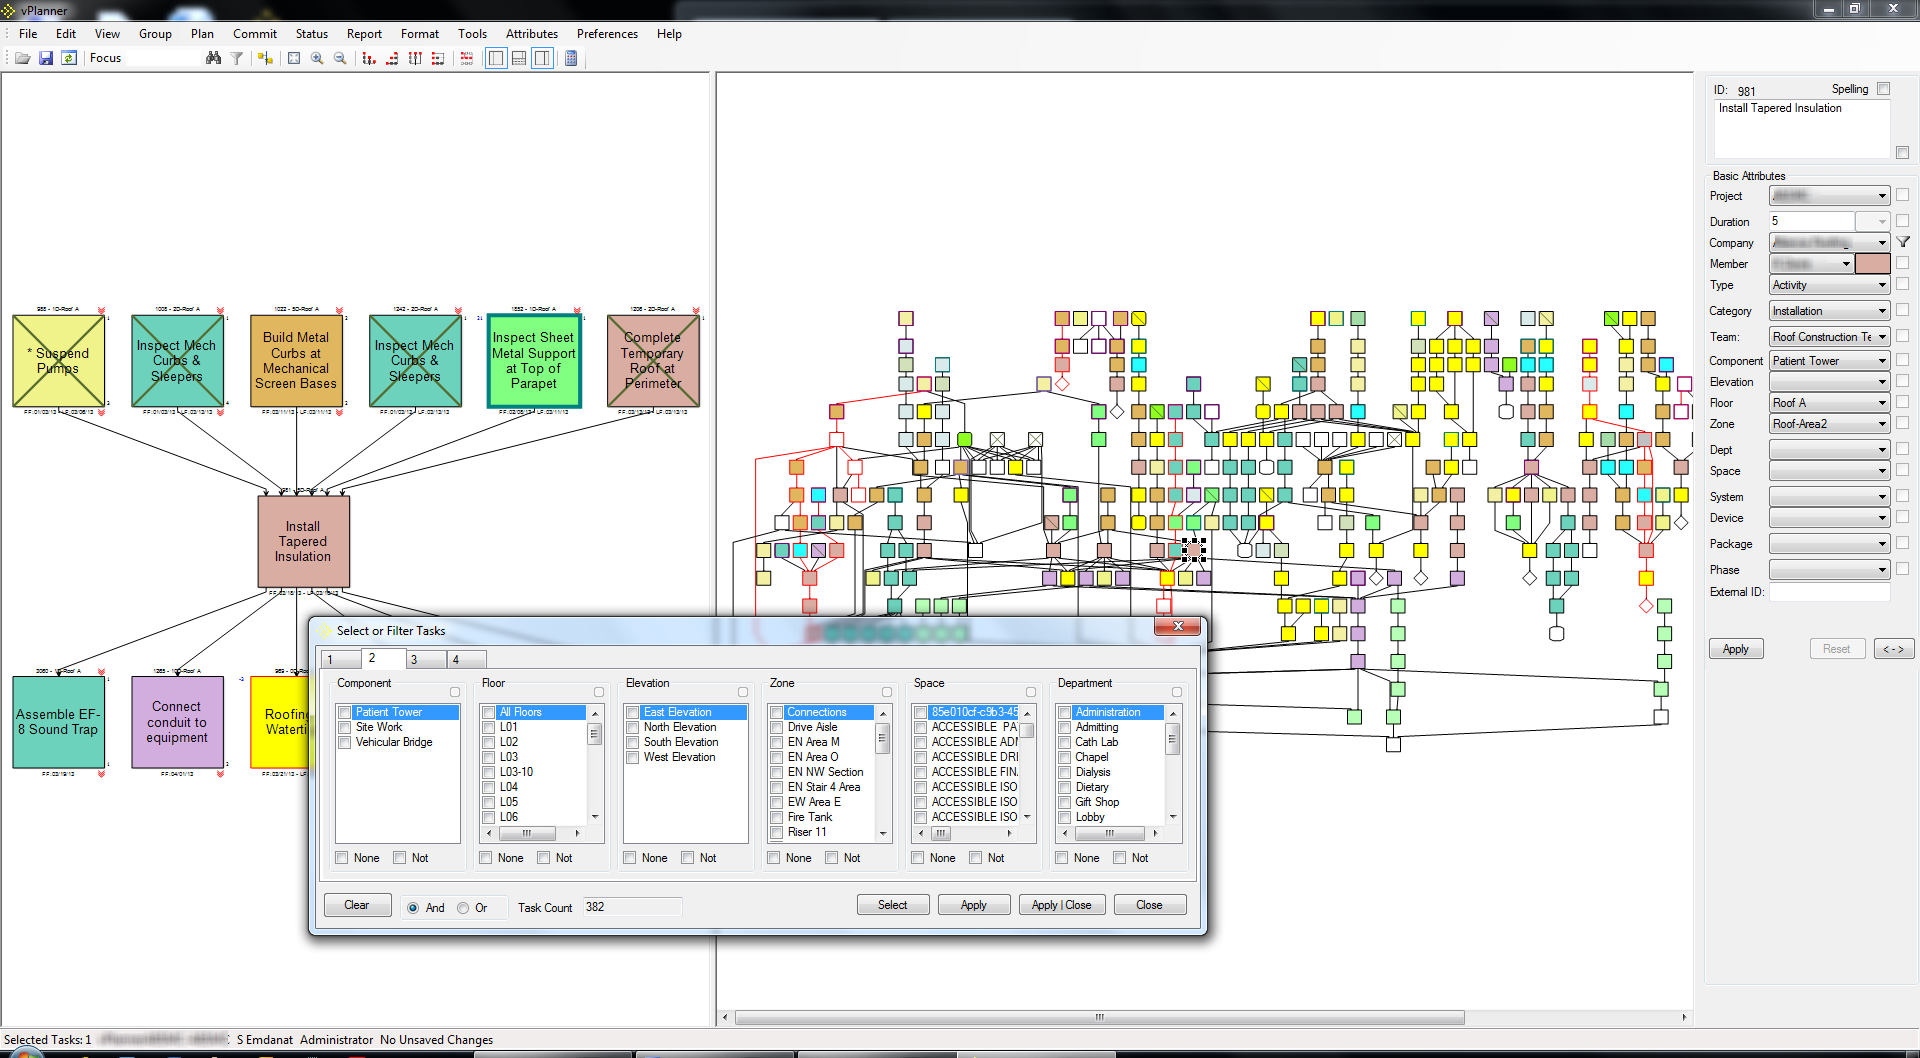
Additionally, you can use different kinds of filters to display only specific aspects of a project plan. Figure 7 shows some of the different filters than can be applied: Component, Floor, Zone, Department, etc. This allows team members to search and display only those tasks based on the selected combination of attributes, for example, all the tasks they have to complete on a specific floor. You can also filter the map by roles, tasks, teams, milestones, disciplines, and in a multitude of other ways.
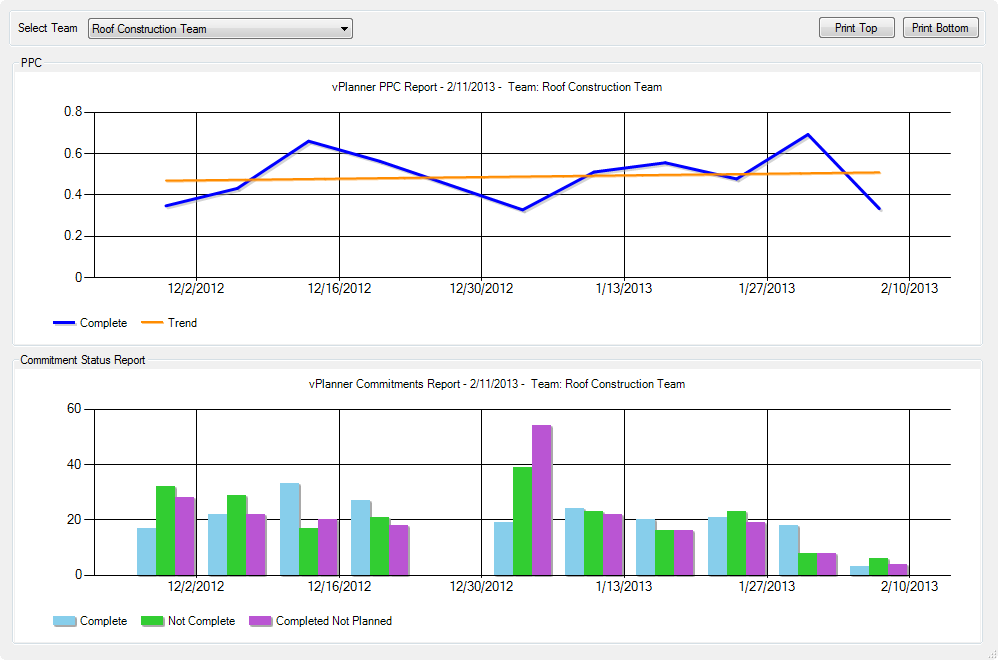
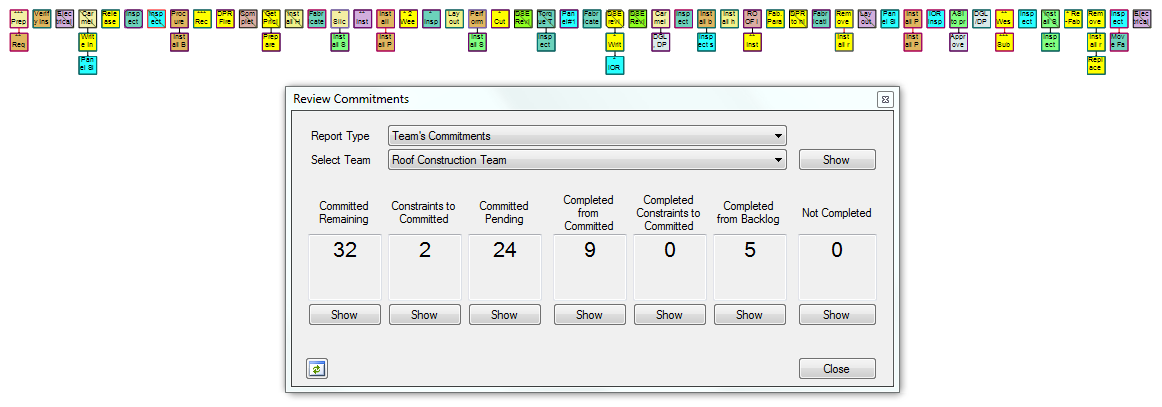
A key capability of the application is that it can provide integrated reporting based on task categories. Visual reports can be generated for design and installation activities and their sequence as well as RFIs, change orders, material deliveries, procurement tasks, and so on. An example of a PPC (Percent Plan Complete) report for the Roof Construction team is shown in Figure 8. It tracks, based on a scale of 0 to1, the percentage of planned tasks that are completed by the team on a regular basis and the weekly trend. The graph also trackes the number of tasks completed, not completed, or completed but unplanned. Such kind of metrics are commonly used to measure overall team reliability. Another example of a report than can be automatically generated by the application, based on a team’s task data, is shown in Figure 9. This is a commitment report in the form of a dialog that provides an overall status of the committed tasks and the ability to isolate remaining tasks on the committed plan.
vPlanner is a multi-user client-server solution. All the information related to a project is stored on vPlanner’s central database server, and it can be accessed via a client application installed on a computer. This allows multiple team members to work on it simultaneously, make it possible to edit complex plans with thousands of tasks in real-time. Different types of access level permissions can be assigned to different users, including read-only, status only, editing tasks assigned to themselves, company level permissions, team level permissions, project level management, as well as full administrative access. Users can check-out and check-in tasks to which they have read/write access, and because of the local client installation, they can perform real-time multi-task editing without being dependent on network performance.
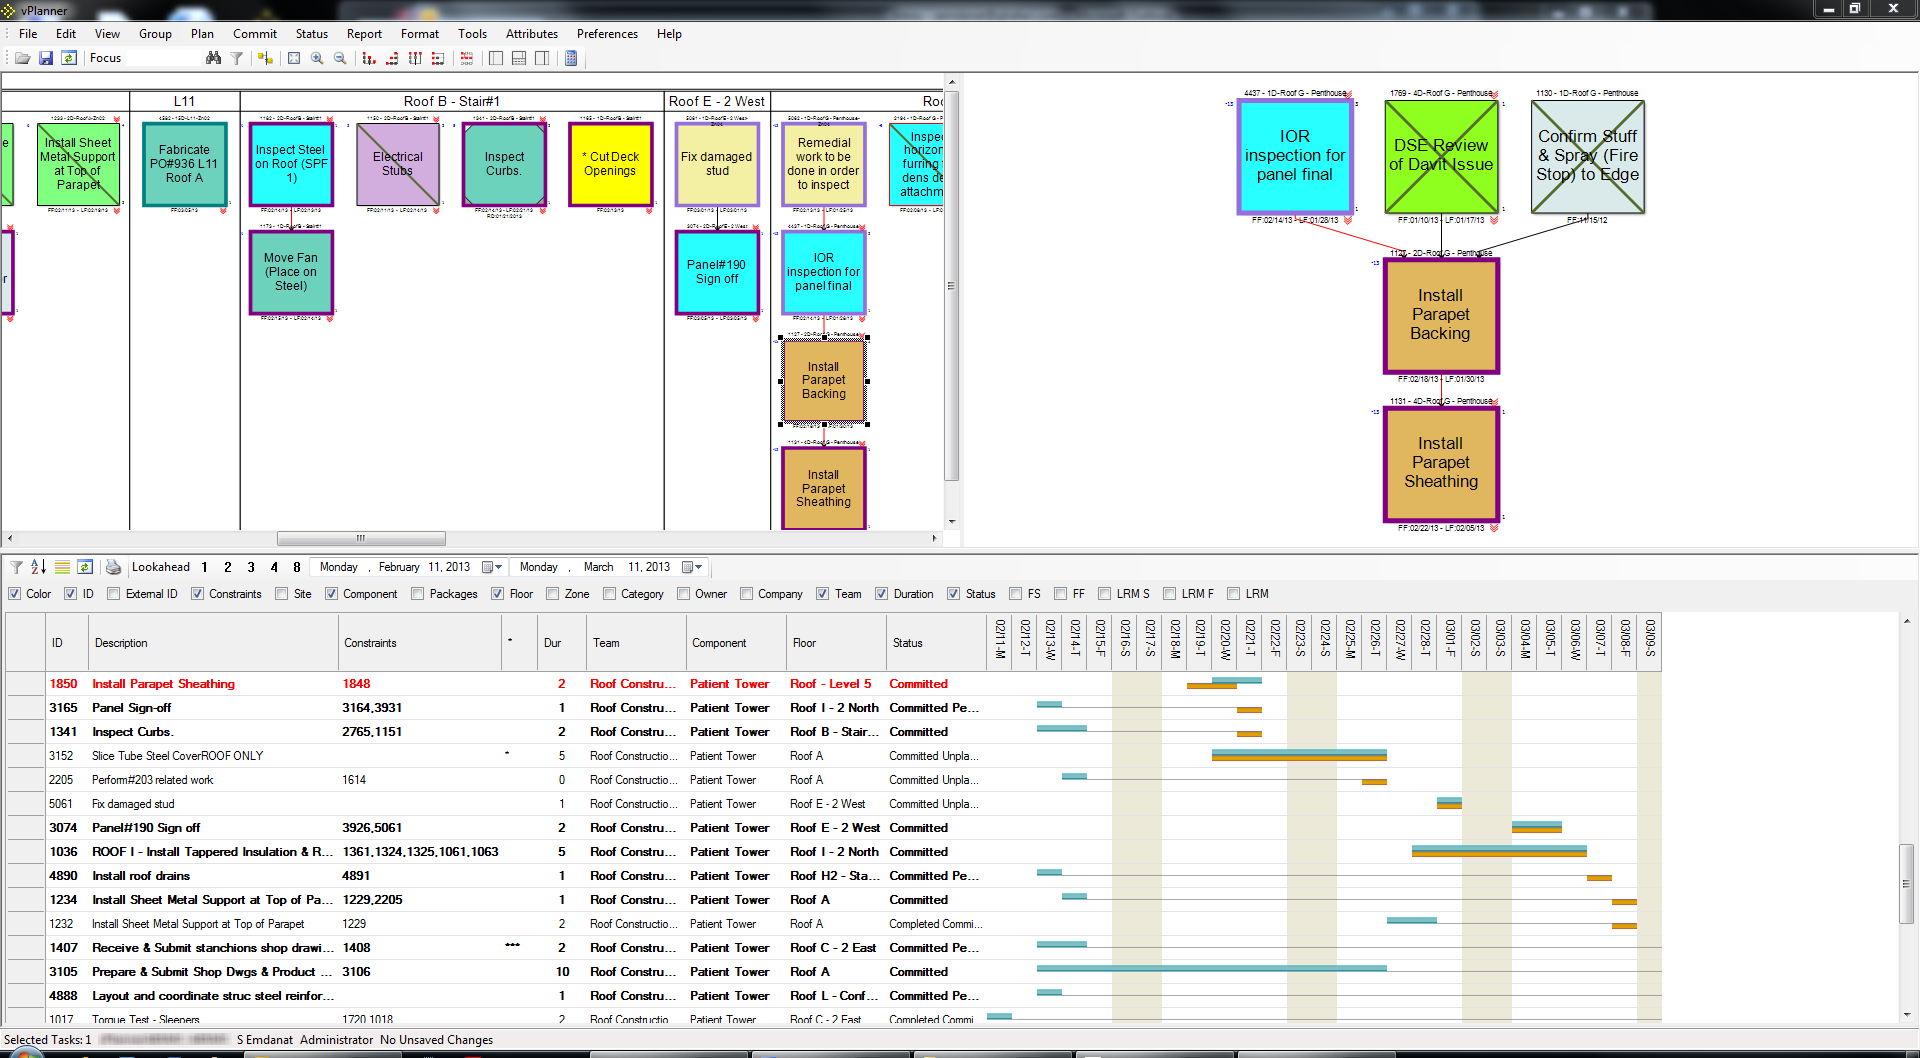
The application also includes a commitment management workflow feature, which allows project teams to set short term goals, create detailed plans, and make commitments towards achieving the goals. There for tools for making weekly or bi-weekly commitments and tracking progress on a daily basis. The application includes pre-configured views that can isolate a commitment plan for a single team, or a particular user, as shown in Figure 10. The main plan area shows the committed tasks, while the smaller graph shows the selected task and its immediate predecessors and successors. The list view, shown in the lower half of the interface, is dynamically liked to the graph and visually show the status of various tasks.
Other noteworthy features of the application include the ability to let teams define milestone dates by creating the most optimal plan to perform the work based on continuous flow, reporting on late tasks and providing “lookahead” views based on tasks and forecast dates, visualization of the critical path (shown in Figure 1) that can let teams know where they should best focus their efforts, and tools for automatically scaling and sizing plans for poster size printing for large team reviews.
vPlanner is an innovative and unique solution to the problem of how best to plan a construction project, minimizing the construction time, avoiding delays, and maximizing the time and resources of all the individual players and project teams that are involved. Most of the tools that are traditionally used in construction planning and management, such as Primavera and Microsoft Project, show the project schedule as a Gantt chart, that can display the start and finish dates of the terminal elements and summary elements of a project, the amount of work completed, and dependency relationships between activities. Visualizing the schedule in this manner provides only a very limited view of the project plan, in contrast to the highly detailed, granular, and visual views that can be seen in vPlanner. It seems as though the focus of the AEC technology industry has been on BIM for so long that we have ignored other areas that are ripe for innovation. It is good to see definite signs of progress in the area of construction planning and management, and it is even better coming from an AEC firm based on its own expertise in this area.
Lachmi Khemlani is founder and editor of AECbytes. She has a Ph.D. in Architecture from UC Berkeley, specializing in intelligent building modeling, and consults and writes on AEC technology.
AECbytes content should not be reproduced on any other website, blog, print publication, or newsletter without permission.