


Navistools is created by Codemill, a software development company located in Kajaani, Finland. The company develops products and plugins for AutoCAD, AutoCAD Plant 3D, Navisworks, and Revit, as well as custom applications for different companies to automate tasks.
Navistools is a plugin for Autodesk Navisworks that allows users to easily link, access and manage their project data between Navisworks and external databases (e.g., MS SQL) and spreadsheets (e.g., Excel). This enables users to share and exchange model information with project stakeholders throughout the different phases of the project, and specifically, facility management.
By linking model data to external databases or spreadsheets, users can manage and update their model information when required. Using various defined groups of elements from the model, for example by using manual selection or through the search sets function of Navisworks, the user can define user-defined tabs to save new data or move existing data to a specific properties tab defined by the user. Users can also track any defined status (e.g., delivered, constructed or inspected) of selected model elements by using a ‘Status’ table and can create custom reports using Navistools Reporter.
This article provides a general overview of Navistools and explains how a user can search, identify and group data in the model and display the data in a user-defined Properties tab. It also discusses how to exchange data between the model and Excel spreadsheets, and concludes with some recommendations for improvement to the application.
Navistools is a plugin for Navisworks. After downloading and installing Navistools, a tab will be added in the ribbon. Through the DataManager icon in the ribbon, you will have access to its window (Figure 1).

Navistools allows users to create different tables using existing data in the model or for new data created by the user. Creating a data table gives users the ability to add new tabs to the Navisworks Properties window. To create a table, the Add Table icon should be selected and the name of the table should be entered subsequently. Tables created are listed in a common list for all projects you are working with. Therefore, consider how you are naming the tables in order to avoid confusion. Also, Navistools does not accept spaces for defining a table name.
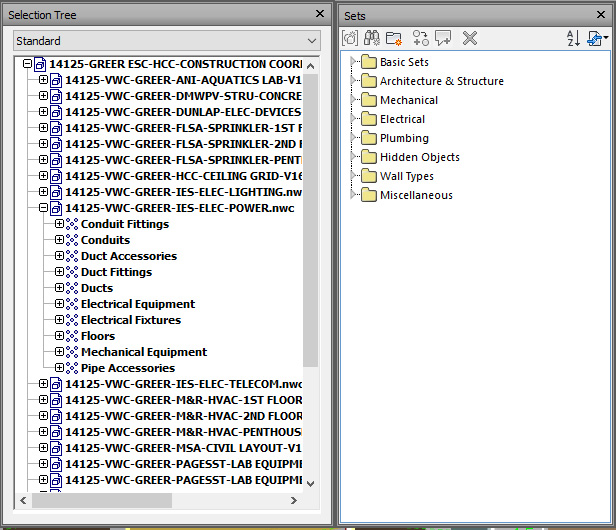
Search sets can be created using any property such as levels, asset type, type of systems, etc. Saving search sets (Figure 2) helps to easily find and select the desired groups of assets and add them to the Navistools window.
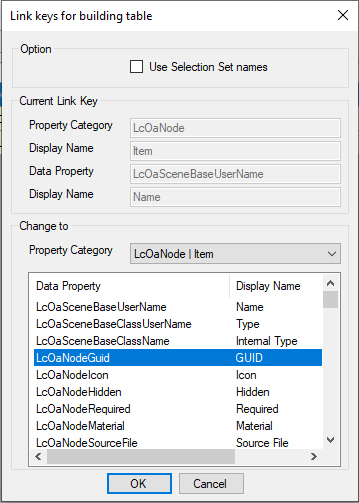
Before entering the desired data into the table, an identifier, which is a unique property associated with the asset, should be chosen in order to be able to match each asset with its data at any time. An example of an identifier can be the GUID parameter (Figure 3) or the Element ID parameter. The identifier can be specified by clicking on the Key icon in Navistools and selecting the desired property from the tabs within the Property window.
After defining the identifier, the user is able to transfer the assets to the table by clicking on the Table icon in the Navistools menu. To transfer the data to your created table, you should click on the Row icon.
Users are able to add columns and rows to the table or delete them by choosing the Rows and Columns icons (Figure 4) on the top right of the Navistools menu. When creating columns and rows, a unique name is required. This has to be defined as a single word, as Navistools does not accept names with space between words (Figure 5).

There are three different ways to populate the Navistools table with asset information. The first option would be to type the data manually in the table. In this case, the user should click the Save icon after entering the data. The second option is to use the Property Updater, a tool that allows extraction of asset information that already exists in the model, and viewable through the Property window of Navisworks. Option three is to export the table to an external excel spreadsheet (or database), update existing information or input new information, then import the data back to Navisworks.
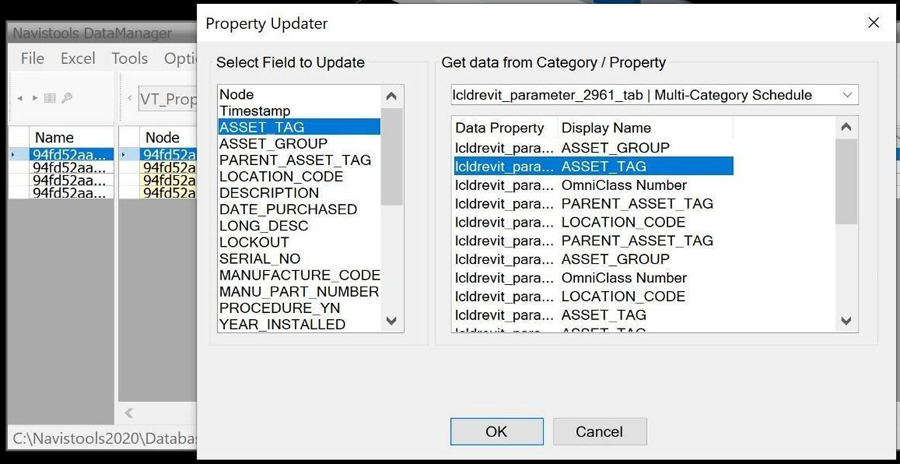
To use the Property Updater tool, which is located under the Tools tab, the name of the column created will be the same as the existing property name in the Navisworks model (e.g., ASSET_TAG) which can be chosen from a list of properties on the left of the Property Updater window (Figure 6). This will use the selected property to name the column in the table and populate it with the property values for the various model elements entered in the table.
Using option three, an initial table created can be exported to an Excel spreadsheet through the Export command under the Excel tab. This allows the user to modify or populate the table with additional data, or to keep a record of existing model data for the model elements exported (e.g., specific data for all Air Handling Units in the model).
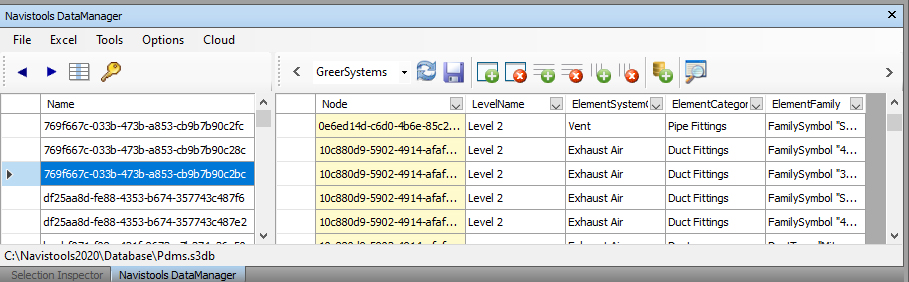
Figure 7 presents an example of an exported table with the Identifier (GUID number) values included under the Node column, along with a system-generated Timestamp column (required to import the spreadsheet back to Navisworks) and other columns selected to be exported—in this case the ASSET_TAG column. Additional columns and fields can be added to the spreadsheet and imported back to the Navisworks model. As indicated earlier, new column names cannot include spaces in the name, otherwise an error will occur when the spreadsheet is imported back.

After completing the editing of the spreadsheet table, you can import it back into Navistools using the Import command under the Excel tab. There are two options to choose from: Update an Existing Table or Import to a New Table. To use the first option, the names of new columns created and populated in the Excel spreadsheet have to match pre-existing columns in the Navistools table. Importing using the second option deletes all previous data in the Navistools table and recreates the table with data from the Excel spreadsheet. When importing a spreadsheet into Navisworks using either option, data from the spreadsheet is mapped to rows in the Navistools table using the Identifier values (i.e., the Node column).
Users can also use Data Source under the File tab to use data that already exists in an external data source or to link their data to an external data source. SQLite, SQL Server, Oracle, MySQL and PostgreSQL are supported by this feature.
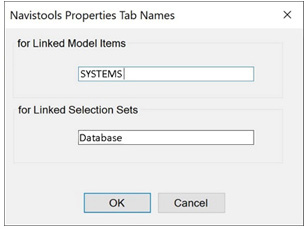
Once all asset data is populated in the Navistools table, the user can move the data to a user-defined tab by choosing the Navistools Properties Tab Names under the Options tab. The user can define the name of the new tab, e.g., SYSTEMS, which will be created in the Properties window of Navisworks (Figure 8).
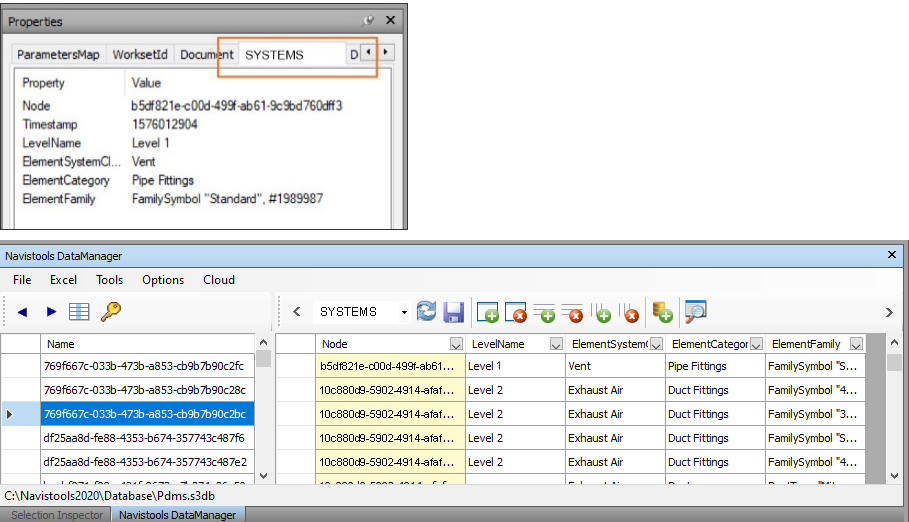
The data can then be embedded to the model by clicking on the Embed Database Information option under the Tools tab. Subsequently, a new user tab will be created in the Properties window and populated with the properties and values defined for the model elements specified in the table (Figure 9).
Another feature in Navistools is the ability to modify the color of model elements based on a specific status value specified by the user. For example, the color of model elements that are erected or inspected can be a specific value based on a user-defined color legend. This feature uses the Status table, a system-defined table that allows the user to assign colors to corresponding model elements based on parameter values associated with each element's status. The table has three pre-defined columns: Name, Status, and Color. As shown in Figure 10, values defined under the Name column correspond to the column names in the Navistools user table, values defined under the Status column correspond to parameter values in the Navistools user table, and colors under the Color column are defined by the user to represent a status value for any element.
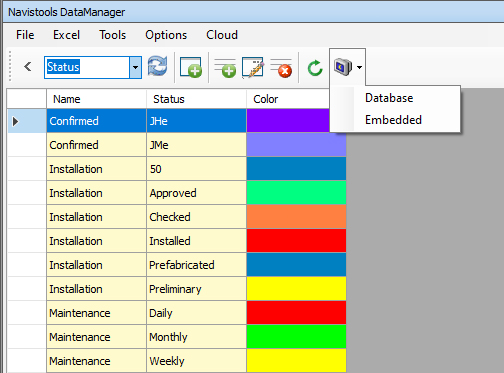
Once all status options are defined and assigned a color, the user can reflect the color changes in the model by invoking the screen icon and selecting either Database or Embedded. The first option reads the data associated with the element status from the database. The second option reads the data associated with the element status changes from the Navistools table, if the user has not saved information in the table to the database yet. For example, in case of testing different outcomes.
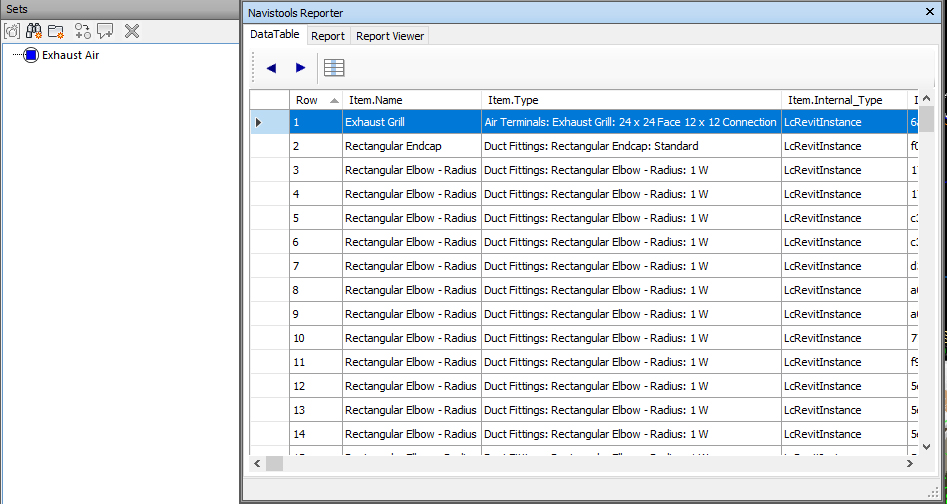
Navistools Reporter is used to capture and present property data that exists within the Navisworks model and linked databases. The user can select model elements and enter them into a report table by clicking on the Report icon under the DataTable tab, as shown in Figure 11.
After populating the table with the information, the user can select which properties will be presented in the report by checking the boxes for the desired properties under the Report tab in the Navistools Reporter window, as shown in Figure 12. These are then used to populate the report data table.

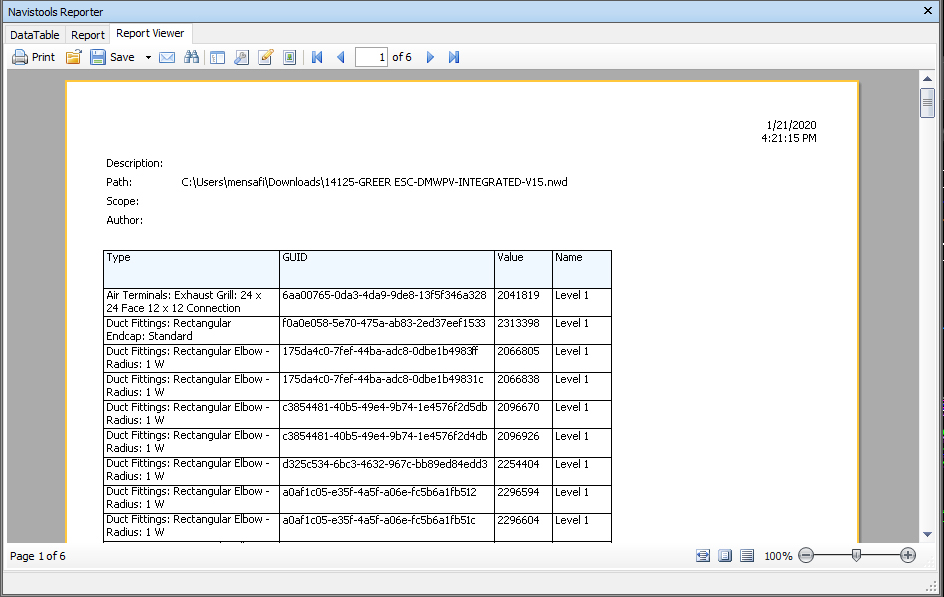
The user can now see the results of the report under the Report Viewer tab, as shown in Figure 13, in portrait or landscape format as required. There are also options to navigate, search, export, and print the data defined in the table using the different tools provided in the Report Viewer’s toolbar.
Users can also use their own templates for their report by using the new custom report under the Report tab, as shown in Figure 14. They can drag and drop the desired properties from the data window into the template and create a custom format and save it. They also have access to the custom formats from custom reports under the Report tab and can edit the custom format at any time.

Currently, if the user creates different tables using the same node identifier (e.g., GUID), the data will not be embedded properly into multiple tabs. In other words, there will be duplications within the tabs and sometimes the data will not appear in the required tabs. To fix the above problem, different node identifiers should be assigned to different tables. In addition, to ensure that the correct data is embedded in each tab, the data should be embedded right after the table is created and before creating the next table.
The current workflow to embed data in the model supports a single user-defined tab. Attempting to send data to multi user-defined tabs require some work arounds.
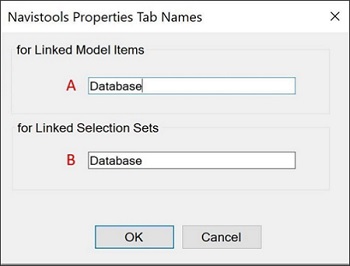
When embedding data from a Navistools table to the model, the default tab name is Database. To change the tab name, the user needs to open the Navistools Properties Tab Names window (see Figure 15) and input a custom name for the tab in field A. For example, the user may change the name ‘Database’ to ‘2ndFloorMaintainedEquipment’.
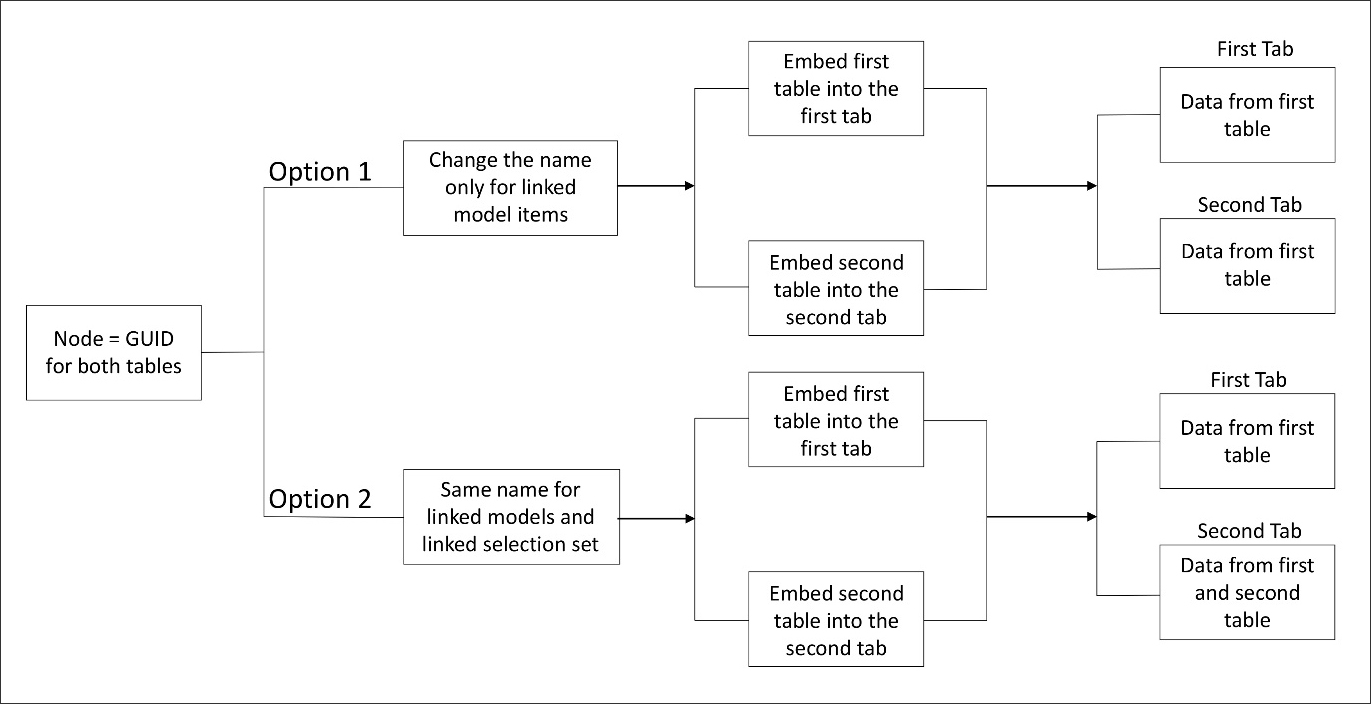
If data from one or more Navistools tables needs to be embedded in multiple tabs, the user will attempt to change the tab name each time. Currently, this creates issues with what data appears under each tab defined. When testing Navistools for embedding data from two tables into two separate tabs using the same reference node (e.g., GUID), the following results were observed:
The above observed results are summarized in the workflow shown in Figure 16.
In order to have two or more tabs created with the correct data embedded in each, the solution tested was to use a single Navistools table with a single Node (e.g., GUID) and have two or more sets of data (to appear in each tab) embedded into the Navistools table separately. Data can be input manually or the table can be exported multiple times as needed to Excel, data populated in the spreadsheet, and imported back to the Navistools table. After completing each data set in the table, the data set can be embedded into the model to a separate tab with a different user defined name. The process can be repeated for as many tabs as needed.
To update data in a tab when data in the source Navistools table changes, the user has to re-embed all the table data into the tab. The data is re-written to the tab erasing all original data. That does not allow the user to update specific parameter values or add new parameters into the tab; they have to re-write the entire tab. A more efficient way to update data or add new data to a tab would make the process more efficient and provide a more realistic solution to situations that require regular updating of asset data in the model.
Another suggested modification to how a user defines a tab name would be to allow the user to do that in the same window as embedding the data. As the user chooses the data to embed, they would define the tab name to embed the data into without having to access a separate window and have to change values in fields A or B, as is required currently. This would not only improve the efficiency of the process, but would also eliminate errors of embedding data into the wrong tab name since the name defining is done in a separate window.
Flexibility in naming the columns would be helpful. The ability to have column names with spaces will also help avoid confusion while exchanging data with external Excel spreadsheets.
It would be helpful if the user can have an option to choose which columns and data to embed into a specific tab instead of embedding the complete table.
Currently, in order to move a row or column in Navistools, you must delete and recreate them in the order desired. It would be helpful to be able to click and drag an entire row or column to allow the user to reorder how data appears in the Navistools table.
Deleting a row or column in Navistools is done by clicking on Delete and entering the name of the column or the row. It would be faster if the user would select the column or row and choose a Delete option. Ability to delete multiple columns or rows this way would be also helpful.
Currently, to delete a tab, the user must select every model element for which the tab is defined and manually delete the tab for that element. This is time-consuming, particularly for large models with many elements that were assigned a user-defined tab. An option to delete the tab for all elements or selected groups of elements would make the process more efficient.
Currently, if the user decides to change the name of the table after creating it, they must delete the table and create a new one. An option to rename the table would eliminate the need of having to recreate the entire table and data from scratch.
An undo command will enable the user to freely explore the tool without having to worry about making errors that require deleting tables or duplicating data entries.
CodeMill has recently released the first version of RevitTools DataManager, a plugin for Autodesk Revit similar to Navistools with similar functionality to exchange data between Revit and external databases including spreadsheets such as Excel. RevitTools includes a Data Management and Reporter modules with a graphical user interface built around a common SQL database that can be easily integrated with other database applications. Users can search, link, tag, color code and report on information and data stored in Revit models and exchange the data with external databases. The user can also add new construction and maintenance data.
We will be looking at RevitTools in more detail in a future article.
 Mahnaz Ensafi is a Ph.D. student in the Department of Building Construction at Virginia Tech. She holds a Masters degree in Environmental Design from Texas Tech University. Her research interests include Building Information Modeling (BIM), Virtual and Augmented Reality and its applications for facility management, and construction safety.
 Walid Thabet, Ph.D., is a 22+ year faculty member of Virginia Tech and has been teaching and developing construction and construction management courses at the undergraduate and graduate levels. His current research agenda focuses on Virtual Design and Construction (VDC), Construction Innovation and BIM for Facility Management (BIM-FM). Dr. Thabet leads the Virtual Facilities Research Lab (VFRL), offering emerging CRE leaders hands-on experience in technology development and practical application as well as access to industry through both corporate and academic partnerships. His recent projects involve collaborative research efforts with several A/E/C industry partners to expand knowledge of BIM and explore emerging software tools and technologies including Augmented Reality.
AECbytes content should not be reproduced on any other website, blog, print publication, or newsletter without permission.