


Many people are surprised by some of the work that I do at SOM. But while we have created a number of sophisticated tools for building modeling and analysis, it is not the work itself that provokes this reaction. Instead, it is the fact that much of the work has been done in AutoCAD. With this program, we have created tools for studying geometric building forms at the very earliest phases of a design project, allowing us to analyze and even adjust these forms to address environmental conditions such as sun and shadows, and other issues such as zoning, views, and size (floor areas and program verification, façade surface areas, and volume). I believe that the approach one takes in solving a problem—by thinking creatively and not being constrained by one's own thinking or by a limiting set of tools—is the key to innovative designs and design processes. Often a simple and flexible tool like AutoCAD can be more helpful than a very sophisticated tool designed to solve a problem in a particular way.
Two hot themes in computational design for architecture currently are "building information modeling (BIM)" and "parametric modeling." Many people associate BIM with particular software tools, as is also the case with parametric modeling. I propose that these concepts are less related to the tools one uses, and more to the approach architects take in their design process. This Viewpoint article focuses on parametric modeling as a design approach, and AutoCAD—which is not typically considered a parametric modeling tool—as a perfectly acceptable tool for applying this approach.
Building models are representations of buildings. Architects are experts at modeling buildings. They can conceptualize a building in their minds and often they must document the building to record these concepts and ideas and share them with others. These documents are building models. Plans, elevations, and sections are also building models, as are renderings, physical scale models and virtual representations in a computer.
Building models can be explicit, where every aspect of the model is well-defined and can be described, typically without referring to other parts of the model. A computer model in which a building is represented explicitly allows us, for example, to get the coordinates of any point in the building. This information can be used to create various representations (plans and sections, renderings, and physical models) and even to create a real building. During the design process, decisions about the building are being made as the model is being built. At the same time, aspects of the model are being analyzed, tested and modified.
Parametric building models are a bit different. Aspects of the model depend upon relationships between parts of the building. Creating and modifying these relationships is an important part of the design process. A parametric model is often defined by rules and constraints, which define aspects of the building and their relationships to each other. Changing a rule or constraint, or modifying a part of the model itself, almost always has implications on the entire model.
Another way to distinguish between the two models is that in the first type of model, the geometry is explicit and the rules are implicit—there are always rules and constraints in an architectural model, but the modeling tool will not keep track of them so we have to. In contrast, in parametric models, the rules are explicit and the geometry is implicit. Several tools have been developed in the past decade for creating parametric architectural models. These include Digital Project, an application based on Catia by Dassault Systems and developed for architects by Gehry Technologies; and Generative Components by Bentley Systems, which runs within MicroStation.
Parametric tools allow relationships among components in the model to be defined, and parameters that control aspects of the building to be defined and changed—from physical characteristics to environmental parameters, and even aspects such as projected occupancy. For example, a building can be described as an extruded rectangular form with a pitched roof. As the dimensions or shape of the rectangle or the height of the extrusion is changed, the roof will automatically be modified in order to still fit perfectly. Height constraints can also be specified and warnings will be issued if certain conditions cannot be satisfied. In essence, the building is being modeled by describing the rules the building must follow. At SOM, we are exploring and implementing parametric tools and their use in a variety of design applications, from complex stairs that respond to a building occupancy parameter, implemented for one of our projects using Digital Project, to buildings whose form responds to environmental conditions such as sunlight. Work in this area has already been done (in AutoCAD!), and we're exploring sharing data and allowing two-way interaction between design/modeling applications and analysis applications.
In conventional modeling where we explicitly describe the building, when we change one aspect of the model, often we must make several changes to satisfy our design intent-in other words, the implicit rules of the design. This is because the software does not keep track of the rules and we must decide whether and when they are broken. In AutoCAD, models can be created in a conventional way. AutoCAD, however, comes with more than one programming environment for creating a set of instructions, including the rules and constraints of the design as well as parameters defining certain aspects of the design, which can be used to build the model. We can use these instructions to build a model from scratch, each time using the same parameters, or experimenting with different ones. The parameters can be numeric values (e.g., FootprintWidth = 120'-6", FootprintDepth = 84'-0", MaxBuildingHeight = 78'-0"), relationships (e.g., FootprintDepth = FootprintWidth*0.6666), and can even include graphic parameters already existing in the model (e.g., a building lot, context buildings, a zoning envelope, etc.). The programming environment makes it possible to define variables, to allow conditional branching to different sets of instructions in the program, to repeat instructions until a condition in the program or model is met, and to interact with the model for the transfer of information.
The next section describes and illustrates some examples of parametric modeling done with AutoCAD for exploring specific aspects of design projects at SOM.
Note: All images in this article are provided courtesy of Skidmore, Owings & Merrill LLP, and may not be used without permission.
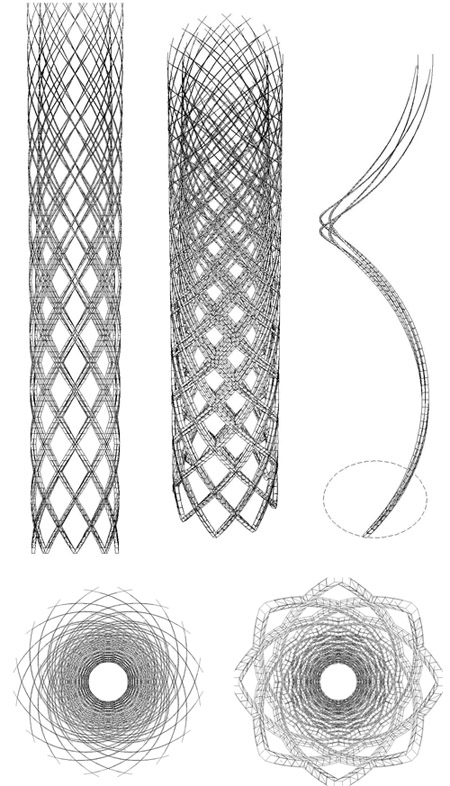
Figures 1 and 2 show views of a cylindrical diagrid generated by a lisp program, which is used to explore different options for modeling a building's structure. Close to a hundred variations were modeled, of which two are illustrated here. In each case, a single diagrid member, which spirals from the base of the building to the top, is created by the program and repeated by rotation and reflection to create the entire structure. In the second example shown in Figure 2, as in most of the models, the member varies from bottom to top, in this case by splitting (one member at the base splits into four members) and by tapering.

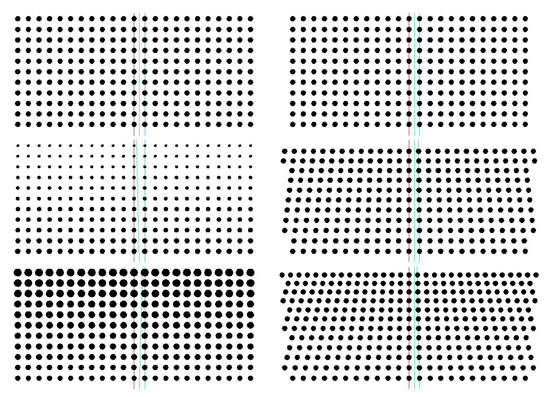
Figures 3 and 4 illustrate another example of a lisp-based model, in which a frit pattern for glass is generated based on simple graphics that control the parameters for generating the pattern. In each case, the red line is the centerline of the pattern, the blue line determines the spacing of the dots, and the green line determines the size of the dots. We have used these lisp routines to generate frit patterns for a variety of design projects, where we can control the area/percentage of opacity of the glass, and vary this in a controlled and interesting way over the panel.

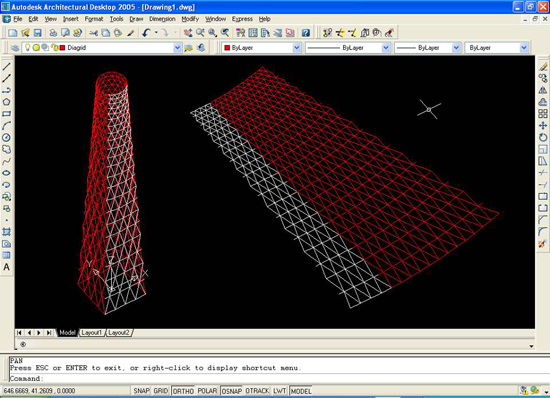
Many of the processes described here were used in the design, analysis, and documentation of the building project shown in Figure 5, which is the Lotte Tower in Seoul, Korea. The building model is created both as a 3D model and as an unfolded model for laser-cutting, as well as for representation (see Figure 6). The lisp program generates one-quarter of the structure, and uses symmetry to complete the models. Parameters in the program control the diagrid—the parameters are refined after many iterations to optimize structural performance, program area contained within the building, and aesthetic judgments. The form of the 550+ meter tall tower transforms from a square at the base to a circle at the top.

We also used AutoCAD-based parametric modeling to develop a tool for analyzing solar incidence angles for the project, as shown in Figures 7 and 8.
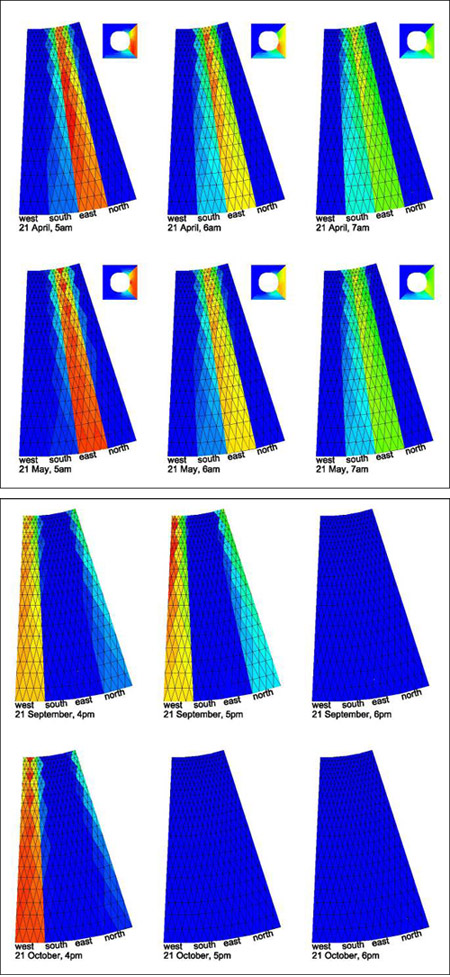
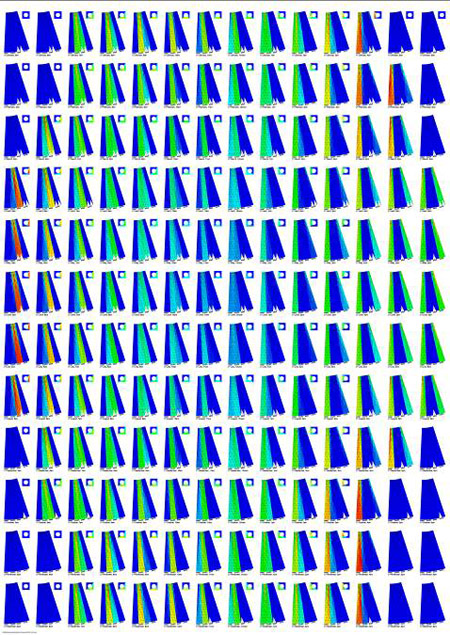
The summary image shown in Figure 9 was part of our competition entry package for this project (which we were awarded), and represents a solar incidence angle analysis of the tower. An analysis was performed for each facet of the tower model. At each hour from morning to evening for one day of each month, the normal vector of each facet was compared to the direction to the sun. If this angle is small, the facet is getting direct sunlight, causing poor energy performance and decreasing occupant comfort. Small angles are indicated in red and as the angles grow—and energy performance improves—the color changes to orange, yellow, green, and blue respectively. While the analysis was done on a three-dimensional model, the results are shown on an unfolded model, allowing us to see a "report" of the analysis for the entire building in a single image.
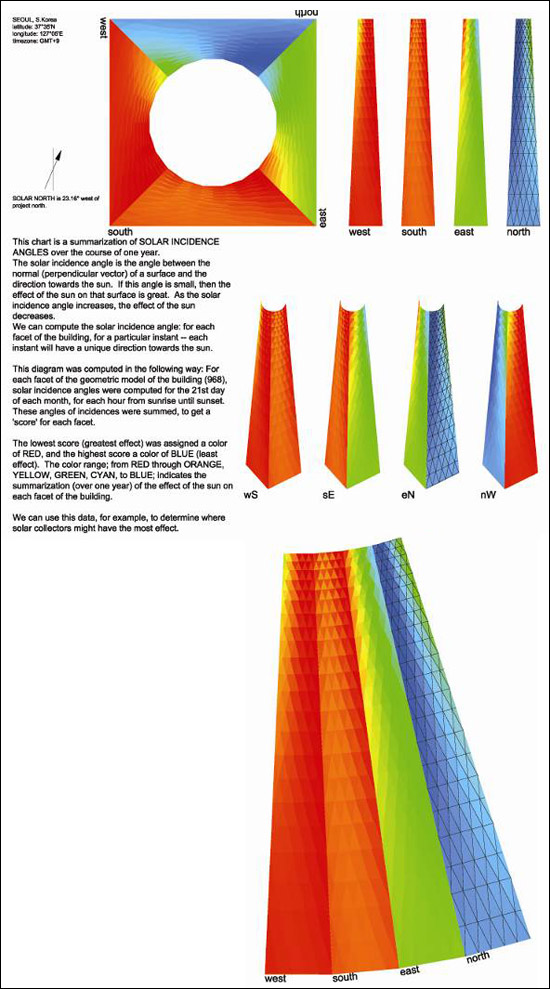
While most of the programs that we create at SOM are to address a problem raised on a particular project, we always try to generalize a solution so that we can re-use it when a similar problem comes up again on other projects. A good example of this is the frit program, which has been through an extensive generalization process and has been used across many projects to design fritted glass. In contrast, the solar incidence angle analysis tool was recently developed and the Lotte Tower project was the second one in which it was being used. It did, however, have to undergo several modifications to satisfy the needs of this project. Often, the tools that we develop can be used very effectively in relationship to one another. For example, the summary solar incidence angle report shown in Figure 9 was used to determine on which panels of the Lotte Tower more frit had to be applied. This was important to protect those parts of the building from the greater amount of direct sun they will be subjected to. Similarly, less frit can be applied to the glazing on those areas of the building where there will be less direct sun.
At SOM, our building information models are the result of a very rigorous process of design. While we are using such tools as Revit, Digital Project, Generative Components, Ecotect, and others, our process not only takes advantage of the strengths of these tools, but is additionally enhanced by complimenting features with our own customizations. In many cases, we do this by exploiting the simplicity and universal, all-purpose environment of an application such as AutoCAD.
 Neil Katz is an architect, and has been with
SOM for over twenty years. He has been involved
in the "computational design" aspects
of many projects, often suggesting solutions to
geometrically complex issues that arise in the
design process, and typically creating computational
tools to address these.
Neil Katz is an architect, and has been with
SOM for over twenty years. He has been involved
in the "computational design" aspects
of many projects, often suggesting solutions to
geometrically complex issues that arise in the
design process, and typically creating computational
tools to address these.
AECbytes content should not be reproduced on any other website, blog, print publication, or newsletter without permission.